CCNC/CCNC Module 6/Inserting Graphics/Subsection 3 Drawings
| Work in progress, expect frequent changes. Help and feedback is welcome. See discussion page. |
| Inserting Graphics |
Inserting Clip Art |
Inserting Images from File |
Art Gallery and Drawings |
Graphics Operations |
Inserting Charts |
Inserting Charts from Spreadsheets |
Show Me |
Contents
Tutorial 3 - Using the Art Gallery to Draw Objects
Introduction
Openoffice provides a host of tools that can be used for drawing user defined images. Consider your presentation to funders, and you would like to put a custom process that your learners go through from the time they apply for admission, through to the time they graduate or leave your organization. While you can draw this process on paper and scan it for eventual migration to your presentation, you can also use the drawing tools provided. This will make your presentation neater and more appealing.
Know the Drawing Tools
The toolbars in are located in a floating panel or on the top or the bottom of the Impress screen. To view the Drawing toolbar, go to View|Toolbars|Drawing. Click on Drawing so that a check mark appears beside it on the menu. The Drawing toolbar in Impress
The table below summarizes all the frequently used icons.
The following is an explanation of basic tools on the TOP Impress toolbar, from left to right.
- Line- this tool allows you to change the width and style of lines. It can also be accessed by right-mouse clicking on an object.
- Arrow Style -this tool allows you to change the direction and arrow head by clicking on a line or arrow that has been added to the presentation. It can also be accessed by right-mouse clicking on an object
- Line Style -this tool allows you to adjust the line format.
- Line Width -this tool adjust the line width of objects.
- Line Color -this tool allows you to change the line color of objects.
- Area -this tool opens a window that gives you many options for changing the fill, color, gradient, and texture of a shape object.
- Area Style/Filling -this tool is a two part tool. Select an option from the first window, such as gradient. Review the many choices for gradient in the second window and click on one to choose it
- Shadow tool -this tool applies a shadow.
Using the Drawing Tools
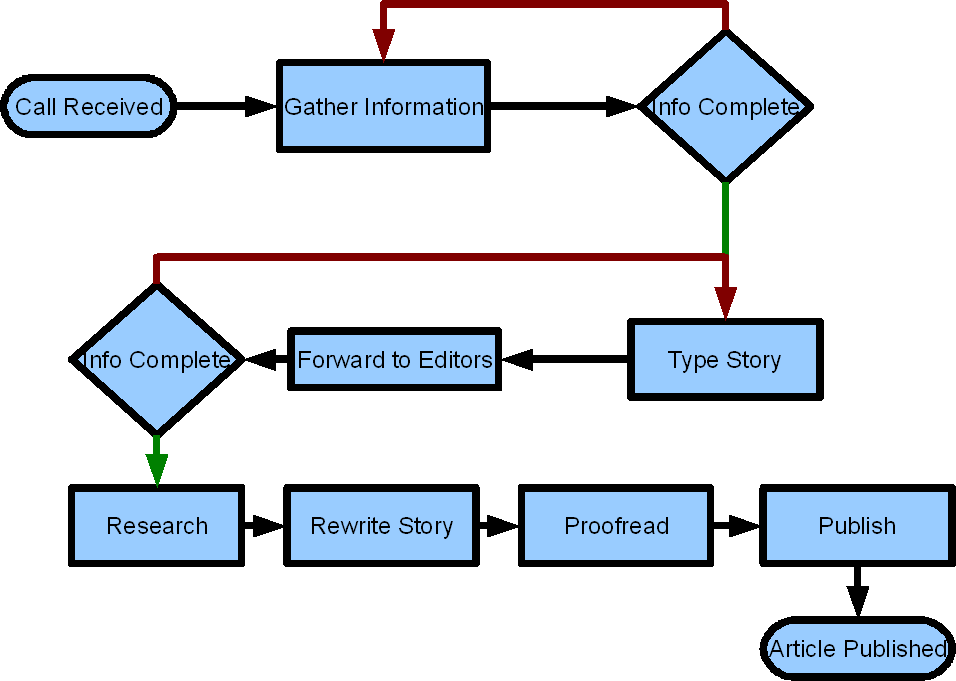
For this tutorial, we will create a simple process diagram depicting how News flow in the an Newspaper Firm from the time they are gathered, to the time they are printed. A case at hand, is:
- Call is received at the News hotline a
- A journalist is dispatched to the scene.
- Journalist collect all the information which involves
- Taking pictures
- Interviewing people around the scene
- Journalist gets back to the workstation and types the story
- Journalist forwards the story to the editorial team
- Editorial team:
- Proofreads the story
- Does research on similar incidents that can enrich the story
- Editorial team:
- Rewrites the story with all the new and necessary information OR
- Sends it back to journalist for corrections or updates.
- The story is sent to the desktop publishers who do the type-setting and
- The story is printed.
Determine the Tools to Use
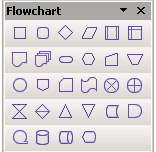
For this process, the flowchart shapes would be the best. We need to identify the shapes in the flowchart tool to use. The figure below shows the various flow shapes. Moving a cursor on each of them would give an intuitive name of when/how to use it.
For simplicty purposes, we will use the basic four shapes: Terminator, Process, Decision, and Connector.
Joining them Together
To join, we use the connector tools to join the various workflow elements. We use a color legend for the arrows for the decision shapes. A green for the right to go ahead, and red for the task to go back or to be rectified.


