Snow graphing
| Instant wiki maker | Making handouts | Editing tips |

Biology In Elementary Schools is a Saint Michael's College student project from a course that ran between 2007 and 2010 and fully described in this book chapter. The student-created resources have been preserved here for posterity. Link under 'toolbox' for printer-friendly versions of the exercises. Click on handouts to print full resolution versions. Please see Wikieducator's disclaimer, our safety statement, and the Creative Commons licensing in English and in legalese.
Introduction
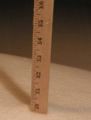
This can be a simple graphing activity. You could also choose to use the data for linear regression. I have posted photographs of a yard stick taken at regular intervals during the February 14 2007 snowstorm in South Burlington Vermont. The times are given under each photograph, and snow accumulation can be recorded by zooming in (single click) on the photographs.
Suggestion progression of activity (stop at level appropriate for your grade):
- Make data table recording time and snow depth.
- Convert to metric units perhaps.
- Line graph of data set.
- Measure slope to measure rate of snow accumulation (express in inches per hour; or per minute).
- Run a linear regression to determine if a significant relationship exists between time and snow accumulation.
Valentine's Day storm
- Data set 1;Valentine's Day snow storm 2007, South Burlington Vermont
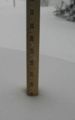
Figure 1. Snow accumulation at 3:15 during a snowstorm on Feb 14 2007 in South Burlington Vermont USA; click to view closer
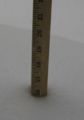
Figure 2. Snow accumulation at 3:45; click to view closer.
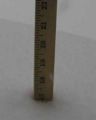
Figure 3. Snow accumulation at 4:15; click to view closer.
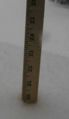
Figure 4. Snow accumulation at 4:45; click to view closer.
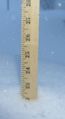
Figure 5. Snow accumulation at 5:15; click to view closer.
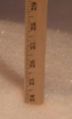
Figure 6. Snow accumulation at 5:45; click to view closer.
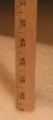
Figure 7. Snow accumulation at 6:15; click to view closer.
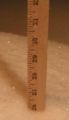
Figure 8. Snow accumulation at 7:00; click to view closer; please note that this and the next image are not at 30 minute intervals.
Snow accumulation at 10:45:00; click to view closer; please note that this and the previous image are not at 30 minute intervals.


Saint Patrick's Day storm
During this storm, the meter stick was in a pile of old snow that measured about 40 cm wide. Snow tended not to accumulate as rapidly because of the small surface size.
- Data set 2;Saint Patrick's Day snow storm 2007, South Burlington Vermont; note the metric units
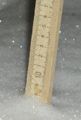
Figure 9. Snow accumulation 9:00PM
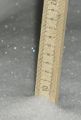
Figure 10. Snow accumulation 9:30PM
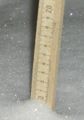
Figure 11. Snow accumulation 10:00PM
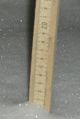
Figure 12. Snow accumulation 10:30PM
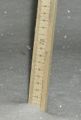
Figure 13. Snow accumulation 11:00PM
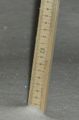
Figure 14. Snow accumulation 11:30PM
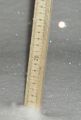
Figure 15. Snow accumulation 12:00AM
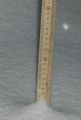
Figure 16. Snow accumulation 7:30AM; note the shift in in timing.
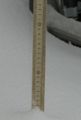
Figure 17. Snow accumulation 8:30AM; note the shift in in timing.
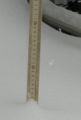
Figure 17. Snow accumulation 10:10AM; note the shift in in timing.


Contribute your own data
Upload a series of photos from your favorite storm! Comparative graphs might be interesting.