Lovely Lungs
| Instant wiki maker | Making handouts | Editing tips |
Contents
- 1 Student worthiness
- 2 Primary biological content area covered
- 3 Materials
- 4 Handouts
- 5 Description of activity
- 6 Lesson plan
- 7 Activity In Action
- 8 Potential pitfalls
- 9 Math connections
- 10 Literature connections
- 11 Connections to educational standards
- 12 Next steps
- 13 Reflections
- 14 Citations and links

Biology In Elementary Schools is a Saint Michael's College student project from a course that ran between 2007 and 2010 and fully described in this book chapter. The student-created resources have been preserved here for posterity. Link under 'toolbox' for printer-friendly versions of the exercises. Click on handouts to print full resolution versions. Please see Wikieducator's disclaimer, our safety statement, and the Creative Commons licensing in English and in legalese.
Student worthiness
Tested and was successful
Primary biological content area covered
- Human body
- The lungs
- Respiratory system
Materials
- 2-3 one gallon jugs or soda bottles
- 2-3 large basins
- water
- rubber hose (cut into 2 or 3 pieces, each cut piece should about a meter long)
- cardboard tubes for each participant (for mouthpiece)
- tape to wrap around one end of each hose for making the cardboard tube fit snugly around it
- a measuring device for measuring the students
- a poster board or graph paper to graph results of lung volumes vs. heights
Handouts
Each student should receive one handout prior to the activity (See Figure 1). The handout also serves as a student response sheet for data to be recorded (prior to plotting it on the class graph).
Description of activity
In this activity, students will blow as much air as possible into a tube that will displace water out of a one gallon jug. By measuring how much air is in the jug the students will be able to evaluate their own lung capacity. They will get the chance to explore the relationship between lung capacity and height. A scatter plot (with height as the independent variable and lung volume as the dependent variable) will be instructed to accomplish this. This activity teaches the students about the lungs, the respiratory system, and graphing.
Lesson plan
Pre-activity Preparation
- A bar chart should be pre-made with corresponding labels (names on x-axis, lung capacities on y-axis). Students will enter their information in the bar chart after the activity. (See Figure 6.)
- Label the jugs using intervals of 100 ml. Set up the two or three large basins of water on a flat surface. Holding the palm of your hand over the neck of the jug, turn it upside down into the water (one jug per basin). Slip one end of the rubber hose into the neck of the jug. Hand out one cardboard tube to each student to be slipped over the rubber hose (in the interest of germs).
- Ask students about the respiratory system.
- What does it do (function)?
- What organs make up respiratory system?
Activity
- Measure the students' heights (cm). (See Figure 7.)
- One at a time, ask students to blow out as much air from their lungs as possible (safely) into the rubber tube. (See Figures 4 and 5.)
- The air blowing up will displace some of the water.
- Using the scale on the side of the jug, have each student record their "lung capacity."
- Have students discard cardboard mouth pieces when finished.
- Have the students add their data point to the graph. (See Figure 6.)
Post-activity & Discussion
- After the activity is completed, a scatter plot can be constructed to show the lung capacities of students. Students now can accept or reject the hypothesis that says "lung capacity increases as height increases."
- Discuss the lung's role in the respiratory system.
- What would affect one's lung capacity, function, or breathing in general?
- size of person
- exercise (would affect breathing rate, not lung capacity)
- smoking
- cancer
- asthma
- If time, show pictures of smokers' lungs.
Activity In Action
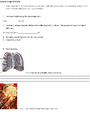
Figure 1. Lovely Lungs Student Handout.
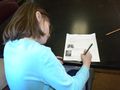
Figure 2. A student brainstorms factors that affect lung volume.
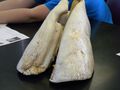
Figure 3. A sheep lung for students to observe.
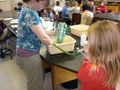
Figure 4. A student tests her lung volume with Kerry's help.
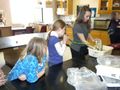
Figure 5. A student exhales a deep breath to test her lung volume with Laken.
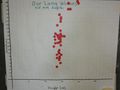
Figure 6. A class graph examining the relationship between student height and lung volume.
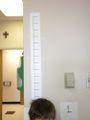
Figure 7. A student is measured with centimeter tape.


Potential pitfalls
Minor mishaps may include:
- The student taking extra breaths in order to reach a higher lung capacity.
- The water basin getting knocked over.
- Students getting upset about their lung capacity being worse than another's capacity.
- Students graphing incorrectly.
Math connections
This activity links to Vermont Grade 3 Standard M3:2. It reads, students will "demonstrate understanding of the relative magnitude of numbers 0-999 by ordering whole numbers; by comparing whole numbers to benchmark whole numbers; or by comparing whole numbers to each other... using models, number lines, or explanations." A very similar standard for Grade 4 is M4:2.
- This will achieved through use of a bar chart, on which students will mark their lung capacity and compare it to the lung capacity of others'.
Vermont Grade 4 Standard M4: 25 "Organizes and displays data using line plots, bar graphs, tally charts and frequency charts, or tables to answer" AND Vermont Grade 3 Standard M3: 25 "Identifies or describes representations or elements of representations that best display a given set of data, Organizes and displays data using bar graphs or tables to answer question related to the data"
- The students will be graphing a scatter plot of the relationship between their lung capacities and heights.
Literature connections
The following books and song will be used for student reference if time allows:
Cole, Joanna, and Bruce Degen. The Magic School Bus: inside the Human Body. New York: Scholastic, 1989. Print. (pages 20-23)
Macaulay, David, and Richard Walker. The Way We Work: Getting to Know the Amazing Human Body. Boston: Houghton Mifflin, 2008. Print. (pages 56-97)
Schoenberg, Jane, Steven Schoenberg, and Cynthia Fisher. My Bodyworks: Songs about Your Bones, Muscles, Heart and More! New York: Crocodile, 2005. Print. (song: Inhale, Exhale)
Connections to educational standards
This lesson meets Vermont standard S3-4:41. In this standard, students must "show connections between external and internal body structures and how they help humans survive." Within the standard, this specific science concept is addressed: "By breathing, people take in oxygen that they need to live. Key structure is the lung."
Vermont Grade 4 Standard M4: 25 "Organizes and displays data using line plots, bar graphs, tally charts and frequency charts, or tables to answer"
Vermont Grade 3 Standard M3: 25 "Identifies or describes representations or elements of representations that best display a given set of data, Organizes and displays data using bar graphs or tables to answer question related to the data"
Next steps
After comparing and finding a relationship between lung capacity and height you could try to find a relationship between lung capacity and something else, such as amount of physical activity per week, birthday, or eye color, and see which things have a relationship with lung capacity and which things do not.
You could also use the graphs to go over mean, median, mode, and range for the heights and lung capacities of the students in the class. (standards M4: 24 and M3: 24)
Reflections
I was very pleased with our activity. Although more time would have been useful, the lesson fit perfectly into the twenty minutes we were given. I was so thankful that we didn’t have to crunch too much into the small amount of time. Before the activity, when we asked the students what the respiratory system was, most of them were at least familiar with the whole idea. This helped to move along the pre-activity lecture. The experiment itself worked well too. We were lucky to have a sink right next to the experiment so we were able to keep filling the bottles back up after each student went. Even with the sink, though, things did get a bit messy with all the water. Planning ahead and having towels accessible is a good idea. The height vs. lung volume graph that we had the class make proved to be valuable. This allowed the students to compare themselves with others. They seemed to enjoy looking up at their red dot in comparison to their teachers. Of all the things in this activity the graph is definitely the must-do! At the end of the activity we had the students think about what we can do to keep our lungs healthy and our lung volume high. Almost all of the students immediately said that not smoking is a big factor in healthy lungs. It was rewarding to be able to reinforce the dangers of smoking. I felt that the students gained a lot from our “Lovely Lungs” activity and left with new and useful knowledge. -Laken
This activity went very smoothly. We began by asking the students what they already knew about lungs. Then we asked them to make a hypothesis about the affect height has on lung capacity. The students were very good at this. Next we measured the height of each student and the students wrote down their heights on their handouts before taking turns testing their lung capacities. They were very good at following instructions on how to blow into the bottles and seemed to get very excited about this part of the activity. Some students asked to repeat this part of the activity but for the most part we did not have time to do more than we had originally planned. The activity filled the entire 20 minutes for each group but we were able to take our time with it and were not rushed. After testing their lung capacities, the students wrote down on their handouts how many milliliters of water they displaced and then added their data to the graph we made. The graph compared height to lung capacity. We asked them if they could see a relationship between the two variables and they concluded that tall people have more lung capacity than short people. To wrap up our activity we had a discussion about what factors might affect lung capacity - what makes lungs healthy and what makes them unhealthy. The students said things like exercise and staying healthy (not sick) keeps your lungs healthy and things like smoking and pollution makes lungs unhealthy. They also wrote these things on their handouts. The only aspect that I feel could have been improved was the graph itself. Our scale for the heights was too small so most of the data points ended up in a cluster with many overlapping. Changing the scale so that the points would have been further apart (for instance going up by two instead of ten and maybe starting at 75cm or 100cm instead of 0) would probably have made the graph more clear. Overall, this activity was a success and it went just as we had planned. The students left having gained a little more knowledge about the human body and had a little more practice making hypotheses and graphing. -Kerry
Overall, I was pleased with the implementation of our activity. Students were excited to test their lung volumes and many asked to retry the activity. At the start of the activity, students were asked about their preexisting knowledge about the lungs. Many knew the function of the lungs, but few could name the body system lungs were a part of (respiratory system). Next, students lined up to be measured and tested their lung volumes using the apparatus. This proved successful, although some students had trouble with letting out only one breath out into the tube and had to restart their test, using a single breath. In the plotting-your-point part of the activity (on the height/ lung volume scatter plot), students exhibited a wide range of abilities with graphing. Some students needed only to be given a dot and plotted their information, others seemed to have never encountered a graph before. To address this, one of us stood by the graph and asked such students to first find their height on the x-axis and find their lung volume on the y-axis (“and where they meet,” students then plotted their point). At the end of the activity, factors that help to increase lung volume and maintain healthy lungs were discussed; students did generate their own responses, saying, “sports” and “not smoking!” When turning attention to our graph, the relationship between height and lung volume was discovered by some students. The relationship was not as distinct and evident on the graph as we expected, but a subtle trend was explained to students and they were able to explain it in their own words. Thus, the highlight of the activity for students was certainly using the apparatus to test their lung volume; while students weren’t as enthusiastic for other aspects of the activity, there is no doubt in my mind that students learned a great deal about lung volumes, their relationship to height, and graphing in general. -Callie
Citations and links
The idea for this activity came from this publication:
Sidley, Elayne. The Human Body. Compton: Educational Insights, 1979.