Hill of beans
| Students @ Work - a student collaborative writing project. Help us by providing feedback on the Discussion page. |
| Instant wiki maker | Making handouts | Editing tips |
Contents
- 1 Student worthiness
- 2 Primary biological content area covered
- 3 Materials
- 4 Handouts
- 5 Description of activity
- 6 Lesson plan
- 7 Example data
- 8 Video clip
- 9 Potential pitfalls
- 10 Math connections
- 11 Literature connections
- 12 Connections to educational standards
- 13 Next steps
- 14 Reflections
- 15 Citations and links
- 16 Common mistakes

Biology In Elementary Schools is a Saint Michael's College student project from a course that ran between 2007 and 2010 and fully described in this book chapter. The student-created resources have been preserved here for posterity. Link under 'toolbox' for printer-friendly versions of the exercises. Click on handouts to print full resolution versions. Please see Wikieducator's disclaimer, our safety statement, and the Creative Commons licensing in English and in legalese.
Student worthiness
I have run this as a demo and I am currently testing it using it to compare unknown solutions.
Primary biological content area covered
Osmosis; hypothesis testing; scientific method
Materials
For each student team:
- Dry beans (black beans work well)
- Plastic cups (we used 236 ml)
- Aluminum plate (any surface that will make noise when beans fall)
- Water
- Solutes (perhaps salt or sugar)
<kaltura-widget kalturaid= size='L' align='R'/>
Handouts
Students will receive Figure 1 to record data in a table and answer research questions during the experiment.
Students will receive Figure 2 to graph and interpret their results.


Description of activity
Students overload plastic cups with dry beans such that there is a hill of beans on top of the filled cups. They can then add different solutions down the side of the cup filling the spaces between the beans. Tap water is readily absorbed by the beans, and as the beans expand, they push upwards knocking beans over the side of the cup. Saturated salty solutions are not absorbed and give a point of comparison.
This time lapse video demonstrates the activity in action.
Because the idea is so inexpensive, students can expand, test hypotheses, and compare different solutions. By gathering data (number of beans displaced) over time, there is an opportunity to make line graphs. End point data (after 60 minutes is reasonable) can be used to generate bar graphs. One could easily bring this to a more advanced level and do statistical analysis of the data.
- Experiment Pictures
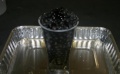
Figure 3. Cup of filled beans
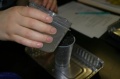
Figure 4. Students pour water solutions into the cup of beans
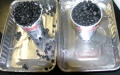
Figure 6. Comparison: which solution pushed more beans out of the cup
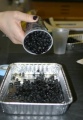
Figure 5. Trying to pour beans out after experiment
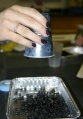
Figure 7. Beans are stuck!
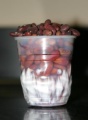
Figure 8. Beans left to observe after a week


- Results: Water Vs. Salt Water (What beans look like aftterwards)
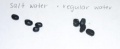
Figure 9.
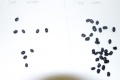
Figure 10.
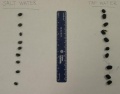
Figure 11.
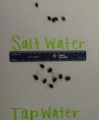
Figure 12.


Lesson plan
- Get 2 plastic cups and label them #1 and #2.
- Place the cups on separate aluminum plates in the middle of your table.
- Fill each cup with beans until they overflow and there is a mound of beans stacked on top of the cup.
- Carefully remove any fallen beans from the plate (sticky tape is useful for this).
- Very carefully pour some of solution #1 (blue lid) into cup #1 filling the spaces between the beans until the liquid reaches the brim.
- Very carefully pour some of solution #2 (no lid) into cup #2 filling the spaces between the beans until the liquid reaches the brim.
- Immediately remove any fallen beans from the plate.
- Record the starting time
- Every five minutes, record the number of beans on each plate
Example data
Table 1. Number of beans displaced from overfilled plastic cups after 60 minutes when either a saturated salt solution, or tap water was added.
| Saturated Salt Solution |
Tap Water |
|---|---|
| 1 |
61 |
| 0 |
67 |
| 0 |
63 |
| 0 |
52 |
| 0 |
39 |
| 0 |
44 |
| Deionized water | Saturated salt solution | Tap water | |
|---|---|---|---|
| 70 | 1 | 105 | |
| 85 | 0 | 79 | |
| 0 | 109 | ||
| 0 | 65 | ||
| 0 | 70 | ||
| 0 | 59 |
Video clip
Time lapse video comparing 2 solutions
Potential pitfalls
- Make sure students fill each cup with enough beans so this experiment will work.
- Do not use glass containers/beakers for this experiment, they WILL shatter.
- Make sure there is enough time allotted for students to observe the beans over time, because it does take a while. It may be smart to plan a side project.
Math connections
While watching the beans, students will collect data and record how many beans fall out of each cup in a table (using Figure 2). Students will then use this data to create a graph showing how many beans fell out of each cup over time. They are then able to compare their results with other classmates and can put together a master graph.
Literature connections
Aston, Diana H. A Seed is Sleepy, Chronicle Books, CA. 2007.
This book would be good for kids to read after they complete the experiment, or during the downtime waiting for beans to collect as they overflow. This book is a good introduction into different types of seeds and contains many plant facts for the students to learn.
Connections to educational standards
7.9-a: Students use statistics and probability concepts. This is evident when students: Collect, order, display, and analyze data in order to answer guestions or test a hypothesis.
7.1 Students use scientific methods to describe, investigate, explain phenomenon, and raise questions in order to: generate alternative explanations; design inquiry that allows these explanations to be tested; deduce the expected results; gather and analyze data to compare the actual results to the expected outcomes; and make and communicate conclusions, generating new questions raised by observations and readings.
Next steps
After this activity has been completed, it may be a good idea to ask students questions about osmosis/diffusion and discuss why one cup of beans pushed more out than the other. It may also be a good idea to have students get into groups and compare their graphs and data. They can then make one big graph as a class to represent their findings.
Reflections
This experiment was done with students at the college-level, and has not yet been used by younger students. However, this experiment worked out well and I'd recommend it for grammar school age students. Students seemed to enjoy observing this experiment and were interested in finding out if their hypothesis was correct or not. Using large aluminum/plastic containers worked well in order to catch all of the beans (no mess). When tried with a glass beaker, however, this experiment did not work because the glass shattered! Students brought previous knowledge of diffusion and osmosis, making this experiment work out smoothly. A must do aspect of this experiment would be to have the kids observe the beans overflowing themselves (they'll be excited and more engaged in the experiment).
Citations and links
Science Experiments; A Little Giant Book. H.J. Press
Common mistakes
This section is strictly for editorial suggestions and will not be part of your final product. The most common editorial suggestions I make are listed here.
| Work in progress, expect frequent changes. Help and feedback is welcome. See discussion page. |