Two-way tables/Self-check assessment
From WikiEducator
Jump to: navigation, search
Use the following quiz questions to check your understanding of simple linear regression. Note that as soon as you have indicated your response, the question is scored and feedback is provided. As feedback is provided for each option, you may find it useful to try all of the responses (both correct and incorrect) to read the feedback, as a way to better understand the concept.
Two-way tables

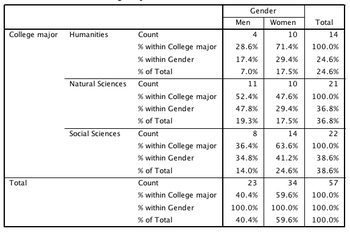
- The number of women who have a social sciences major is 14.
- The number of men who have a natural sciences major is 11.
- The total number of women in the sample is 34.
- The total number of students who have a humanities major is 14.
- The percent of students who majored in humanities is 24.6% (to 1 decimal place).
- 14/57*100=24.6%
- Why does comparing the raw counts of women and men who majored in the different areas not help us understand the relationship between gender and major? because
- Because there are more women than men overall, which means it is not very informative to note that there are 14 women who major in social sciences compared to only 8 men, as the 14 women are out of a total of 34, and the 8 men are out of a total of only 23.
Two-way tables
- What do we need to study if we are interested in the relationship between the explanatory variable and the response variable?
- joint distribution
- That's not quite right. The joint distribution provides the percent (or proportion) of the total sample in each of the cells of the table. That is the cell count divided by the grand total. To address the relationship we need to study the distributions of the response variable for each value of the explanatory variable. Try again.
- marginal distributions
- That's not quite right. The marginal distributions provide the percent (or proportion) for each of the values in the row variable (collapsed across the column variable) and for each of the values in the column variable (collapsed across the row variable. To address the relationship we need to study the distributions of the response variable for each value of the explanatory variable. Try again.
- conditional distributions
- That's correct. To understand the relationship between the two variables, we should study the distributions of the response variable "conditioned on" each value of the explanatory variable.
- Simpson's paradox
- That's not quite right. Simpson's paradox is a relationship which reverses direction when a lurking variable is included. First we would need to address the relationship by studying the distributions of the response variable for each value of the explanatory variable. Try again.
- joint distribution
Two-way tables
- What percent of men have a humanities major? 17.4% (to 1 decimal place)
- 4/23=17.4%
- What percent of men have a social sciences major? 34.8% (to 1 decimal place)
- 8/23=34.8%
- What percent of women have a humanities major? 29.4% (to 1 decimal place)
- 10/34=29.4%
- What percent of women have a social sciences major? 41.2% (to 1 decimal place)
- 14/34=41.2%
Two-way tables
- The table at right provides percents calculated in a number of ways. Which are the percents which would help us evaluate the relationship between gender, as the explanatory variable, and college major, as the response variable?

- % within College major
- That's not quite right. The percents labeled "% within College major" are conditional on college major (the response variable). To correctly examine the relationship we are interested in the percents conditioned on the explanatory variable. Try again.
- % within Gender
- That's correct. The percents labeled "% within Gender" are conditional on gender, the explanatory variable; these are the percents which best help us understand the relationship.
- % within Total
- That's not quite right. The percents labeled "% within Total" are not conditional percents, but rather make up the joint distribution, the percent of observations in each cell out of the total number of observations.
- A combination of "% within College major" and "% within Gender"
- That's not quite right. The percents labeled "% within College major" are conditional on college major (the response variable). To correctly examine the relationship we are most interested in the percents conditioned on the explanatory variable. Try again.
- % within College major
- Which of the following statements correctly interprets the relationship between gender, as an explanatory variable, and college major, as a response variable? (choose all that apply)
- Men are much more likely to choose a natural sciences major than women (47.8% vs. 29.4%).
- That's correct. The comparison of percents for a particular type of major conditioned on men and women, helps us better understand the relationship.
- Of the students who major in the humanities, over 70% are women.
- That's not quite right. This statement is conditioned on the response variable (college major), rather than the explanatory variable (gender). To contribute to our understanding of the relationship, we need to condition on the explanatory variable. Try again.
- The percent of the total group who are men and who major in the natural science (19.3%) is only slight larger than the percent of the total group who are women and who major in the natural sciences (17.5%).
- That's not quite right. Although this statement is true, it does not help us understand the relationship, as these percents are based on the total count; they are not conditional on the explanatory variable. Try again.
- While men have a distinct ordering of preference for majoring in an area: humanities (17.4%), social sciences (34.8%), and natural sciences (47.8%), women's choice of majors is more evenly divided: humanities (29.4%), social sciences (41.2%), and natural sciences (29.4%).
- That's correct. The comparison of percents for a particular type of major conditioned on men and women, helps us better understand the relationship.
- Men are much more likely to choose a natural sciences major than women (47.8% vs. 29.4%).

Notes
- ↑ Adapted from Contingency Tables at Online Statistics Education: An Interactive Multimedia Course of Study. Project Leader: David M. Lane, Rice University. Retrieved 29 September 2012.