One-way ANOVA--smiles and leniency
This activity provides independent practice in use of contrasts and multiple comparisons in relation to a one-way ANOVA.
Contents
Research question
Dale Carnegie stated that smiling helps win friends and influence people. Research on the effects of smiling has backed this up and shown that a smiling person is judged to be more pleasant, attractive, sincere, sociable, and competent than a non-smiling person.
There is evidence that smiling can attenuate judgments of possible wrongdoing. This phenomenon termed the "smile-leniency effect" was the focus of a study by Marianne LaFrance & Marvin Hecht in 1995.[1]
The researchers asked the following questions:
- Does smiling increase leniency?
- Are different types of smiles differentially effective?
Experimental design
Subjects in the experiment were asked to assume the role of a student member of a college disciplinary panel and judge a student accused of cheating. Each subject received a file that contained (a) a letter ostensibly from the chairperson of the Committee on Discipline, (b) a summary of the evidence, (c) background information on the suspect including prior academic performance and a color picture portraying one of the four facial expressions, and (d) rating scales to indicate the judgments. Subjects answered five questions about the likelihood of the suspect's guilt and how severe the punishment should be. These questions were combined into one "leniency score."
Four groups of subjects were tested. Each group saw one of the three types of smiles or a neutral-expression control. Subjects from a sample of 136 college students were randomly assigned to the four conditions with the constraint that there was an equal number of subjects (34) in each group.
The pictures used as stimulus materials were photographs of two college sophomore women. Each was photographed displaying each of the four facial expressions.
Description of variables
| Variable | Description | Example |
|---|---|---|
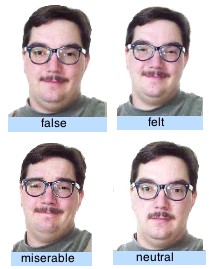
| Smile |
1 = false smile 2 = felt smile 3 = miserable smile 4 = neutral smile (control) |
http://onlinestatbook.com/case_studies/graphics/smiles.jpg
*for illustration purposes, not the actual smiles used in the experiment |
| Leniency | a measure of how lenient the judgments were |
Dataset
Obtain the dataset from one of the following:
- class website: leniency.sav (SPSS file format)
- leniency.xls (excel file format)
Analyses
The following instructions and outline will step you through the analysis process. Copy and paste the following sections into a word processor. Provide responses as indicated.
Planning the analyses
- explanatory variable:
- response variable:
- Specify the overall significance test.
- Ho:
- Ha:
- Significance level:
- Test statistic:
- Degrees of freedom:
The researchers are interested in whether the average of the means in the smile conditions is different from the mean of the neutral condition.
- Design the comparison to be tested.
- Ho:
- Ha:
- Specify the contrast as a linear combination (e.g., c = a1[math]\bar{x}_1[/math] + a2[math]\bar{x}_2[/math] ... ak[math]\bar{x}_k[/math]) to determine the coefficients to be assigned to each condition.
- c =
- Significance level:
- Test statistic (one- or two-tailed):
- Degrees of freedom:
Data analysis: ANOVA, including comparisons of means between groups
- Data collection and examination
- Look at the data. Using SPSS, calculate descriptive statistics and create histograms for each group. Create a chart with side-by-side boxplots for the four groups. Describe the data and shape of the distributions. Describe the comparison of distributions as displayed in the boxplot.
- Explain why the conditions which allow us to safely use the ANOVA test are met:
- Using SPSS, specify and run the following analyses:
- One-Way ANOVA F test (under Analyze > Compare Means)
- Significance test of the contrast (c) as specified above
- The Bonferroni post-hoc procedure to test all pairwise comparisons
- Report the results of the statistical tests (including value, degrees of freedom, and p-value, as relevant).
- ANOVA F-test:
- Contrast t-test:
- Significant pairwise comparisons:
Interpretation
Interpret the analysis results in the context of the research question. Be sure to include important statistics from your analysis results to support your conclusion and to generalize your results to the relevant population(s).
Resources
This activity is based on the case study "Smiles and Leniency" included in Online Statistics: An Interactive Multimedia Course of Study.
References
- ↑ LaFrance, M., & Hecht, M. A. (1995). Why smiles generate leniency. Personality and Social Psychology Bulletin, 21, 207-214.