Stem and leaf plot
From WikiEducator
This glossary is far from complete. We are constantly adding math terms.
For instructions on adding new terms, please refer to Math Glossary Main Page
Stem and Leaf Plot
|
Examples
1. In the number 96, the 9 is the stem and the 6 is the leaf.
Tip: To show a one-digit number (such as 7) using a stem and leaf plot, use a stem of 0 and a leaf of 7.
2. Need an example
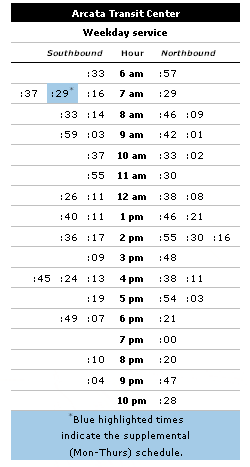
3. A rather interesting, non-statistical use of the stem and leaf plot is shown below. The image depicts a bus schedule, from the Redwood Transit System, as a stem and leaf plot. The hour is displayed as the stem. The minutes, shown separately for southbound (left of center) and northbound (right of center), make up the leaves.

