Learning in a digital age/LiDA104/Create media/Diagram
From WikiEducator
Start here
Tasks
- Visit the Inkscape homepage, and download and install the official release package for your operating system.
- Note: We recommend using an official release package.
- Make sure that you download the version for your operating system, i.e. Windows, Mac, or Linux.
- If you are not sure how to install software, search for "How to install Inkscape" or seek advice from a friend.
- If you are more comfortable using slideshow software, you may prefer trying LibreOffice Impress, which is part of the LibreOffice suite. You can download and install the latest stable version of the software for your operating system. LibreOffice supports the import and export of SVG files (see here).
- Other software options:
- Gravit Designer is a free but proprietary vector based authoring solution. With Gravit Designer, you can either work online or download local versions of the software.
- You are free to use any software package which supports the import and export of open SVG file formats.
- Launch Inkscape, Gravit Designer or your preferred tool and explore the software.
- If you are new to using graphics software, search YouTube for Inkscape tutorials. You will find extensive resources; for example, the Derek Banas introduction to Inkscape tools or the playlist for Inkscape tutorials for beginners published by Davina and Caroline.
- Note: You are not expected to become an intermediate or advanced user of graphics software. All that is required are basic skills to add text, squares, and rectangles; to change colours;and to import/export SVG graphics.
- Conceptualize a chart, diagram, or graphic for inclusion in the learning pathway you are planning to develop.
- Revisit the stimulus resources above to generate ideas.
- Draft a freehand version of the concept for the diagram on a separate piece of paper.
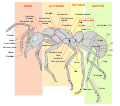
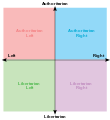
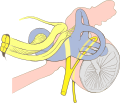
- Conduct a search for SVG graphics that you could potentially copy, reuse, and remix for inclusion in your diagram. A few suggestions:
- Search on Wikimedia Commons, and include the string "SVG" in your search. A good starting point may be the category SVG icons.
- Visit Pixbay's SVG collection - there are a large number of images you can download in SVG format.
- Conduct a web search for openly licensed SVG images.
- Record the urls of the pages of the SVG graphics you would like to download, as well as the names of the authors and license types of the images, all of which will be required when attributing your derivative work.
- See, for example,the attribution of the SVG icons included in this graphic illustrating the structure of an OERu course. Note that this is a SVG graphic, which you could download, modify, and reuse for your own purposes.
- Download and save the SVG graphics you would like to reuse and incorporate in your own diagram.
- Remember to record the url and relevant metadata for attribution in your derivative work.
- Please share your learning journey with our community by posting regularly on WENotes below.
Note: Your comment will be displayed in the course feed.


