DS4OERS KI/Repository/diagram remix/SVG
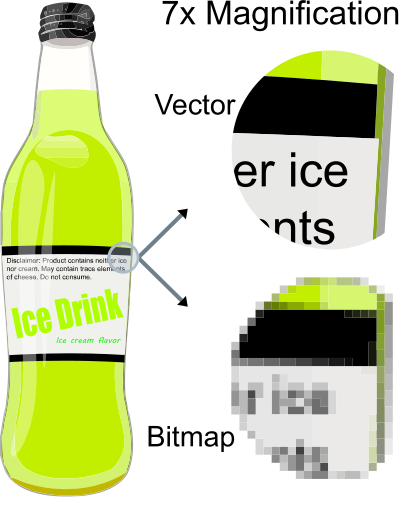
Before continuing with this learning challenge, you need to know the difference between raster and vector graphics, and understand why this is important for teachers developing OER.
Contents
Raster graphics
A raster graphic is a dot matrix structure for displaying computer images or digital photographs. A raster image is made up of a grid of coloured pixels (small squares) which become visible when enlarging an image. The pixelated image below is a small area of a photograph that was enlarged by 1600% to show the pixels of a raster image - this effect is sometimes called 'aliasing'.
Common raster file types include:
- .JPEG or .JPG (Joint Photographic Experts Group): The most common format used for digital photographs
- .PNG (Portable Network Graphics): Commonly used for displaying images online. It supports 'lossless data compression' (which means that the data can be stored more efficiently (using less space) without losing any of the original data), and can also produce transparent backgrounds for overlaying images on existing pages
- .BMP (Bitmap): A raster format that can keep its quality when saving in other raster formats
- .GIF (Graphics Interchange Format): Used for small file digital animations
Considerations when using raster images
You will be familiar with the saying: "A picture is worth a thousand words. In many cases, choosing the right picture to support learning is more effective than describing a concept with words alone. Photographs (raster images) play an important role in developing high quality learning resources. However, there are technical issues and challenges we need to consider.
Images shown on a computer are displayed at a much lower resolution than is needed when printing images, because screen resolutions are almost always lower than printer resolutions. Resolution is usually described as "Pixels per Inch" (PPI) when referring to a computer display, or "Dots per Inch" (DPI) used by a printer when printing an image. Generally speaking, 300DPI is considered the industry standard for printing (although many printers can print over 2000DPI), whereas an image on a computer screen is displayed at about 100PPI (a newer '4k' computer monitor that's 28" across the diagonal (or about 71 centimetres) has approximately 160PPI and some mobile phones have screens with over 400PPI). This means that, even if the image quality looks good on your screen, the resolution may not be good enough or of an acceptable quality when printing.
In practice, this means that you need larger images (higher resolution) for printing. The disadvantage is that high resolution images correspond with large file sizes, so you need to think about the size of the image (in centimeters) on the printed page. For example, to print an A4-sized image so that the image covers the full page at 300DPI, you need a minimum resolution of 3508 X 2480 pixels, which means an image file size of between approximately 5MB (Lossless PNG) to 13MB (Lossless JPEG), which may be too big for environments with low or expensive bandwidth.
These calculations can get complicated, because they are also influenced by the type of file compression used, and by bit to pixel ratios. Don't worry! As a teacher, you are not expected to know this level of detail, but we provide some background information and guidelines to get you started.
When developing teaching resources, we recommend that you don't enlarge the image on the page more than a standard photo print size. This will reduce the file size of images you need to embed in the resource to ensure good quality printing (if printing in colour).
The following table provides an estimate for image sizes printed at 300DPI:
| Size | Image resolution pixels | Maximum print size in CM | Lossless JPEG | JPEG 24bit |
|---|---|---|---|---|
| Standard photo | 1800 x 1200 | 15 x 10cm | 2.2MB | 441KB |
| A5 (1/2 of A4 page) | 2480 x 1748 | 21 x 14.8 | 7.5MB | 885KB |
Practical recommendations for teachers
For most print applications - that is, not showing images larger than a standard photo size in an A4 handout - the following image sizes would be more than adequate:
- Flickr - Download the large size option (2048px x 1647px), anticipating a file size between 300KB and 1MB
- Wikimedia Commons - Download a large size option (2560px x 1920px), anticipating a file size between 500KB and 1.2MB
Don't get too stressed about image sizes. If you download a smaller-sized image which is not suitable for a higher quality print application, in many cases it will be possible to obtain a higher resolution image from the source site. This is another reason why it's important to include the source link in your attributions (so that you can find the source site again!). Also, in many school contexts, the handouts will not be printed in high resolution colour and should be fine for use in the classroom.
Vector graphics
In contrast, a vector graphic is made up of mathematically defined points, lines, and curves (using XML markup). The advantage of vector graphics is that images can be enlarged or reduced to any resolution size without any loss of image quality or 'aliasing'. Of interest, images stored as vector graphics are computationally converted into raster images for display, but at the correct resolution to avoid aliasing.
Common vector file formats include:
- Scalable Vector Graphics or (.SVG) is the most common vector file format. The SVG format is an open standard that was developed by the World Wide Web Consortium and, as a result, a wide range of image-editing applications (both open source and proprietary) support the format. Moreover, today, all modern web browsers support the display of .SVG files, including Firefox, Chromium, Google Chrome, Opera, Safari, and Microsoft Edge.
- Encapsulated Post Script or (.EPS) is a standard vector file format of a graphic, text or illustration. It is widely used by publishers.
Advantages of using scalable vector graphics for teaching resources
There are a number of advantages to using SVG files for developing printable OERs:
- There are a lot of openly licensed SVGs you can download for inclusion in your work
- You don't need to be an experienced graphic designer to develop professional looking teaching resources
- Individual components of an SVG image can easily be edited, so you can change colours, remove components, and combine SVG images to create new graphics
- The size of vector files is considerably smaller than raster images
Tips for teachers
- Vector graphics are usually used for computer-generated images like diagrams or graphs, and not for photographic information. Many vector drawing applications, including LibreOffice Draw, Inkscape, and others, allow a user to 'import' a raster image into the vector drawing, creating a 'hybrid' vector + raster image. This can be very useful - for example, you could create an organisational diagram for a school, and put a little photo of each person next to their position and name. However, it's good to be aware of this challenge: if you import a raster image, it does not become a vector drawing. It is still of limited resolution and can become pixelated if enlarged. Although it can make the vector drawing files rather large, it is usually a good idea to import the highest resolution version of a raster image that's available, to ensure that it won't become pixelated. Normally, you can re-size the version of the image that shows in the drawing on your screen, but the original resolution of the image won't be affected.
- Also, if you look at the screen representation of a vector drawing, and take a screenshot of it, that screenshot will be a raster file rather than a vector file, and it will have the resolution of the screen from which you took the screenshot. To distribute a vector drawing and preserve its vector nature, you need to make the original file available in SVG format.

