File:SP-predictability-curve.png
From WikiEducator
Size of this preview: 800 × 578 pixels. Other resolution: 1,174 × 848 pixels.
Original file (1,174 × 848 pixels, file size: 93 KB, MIME type: image/png)
Summary
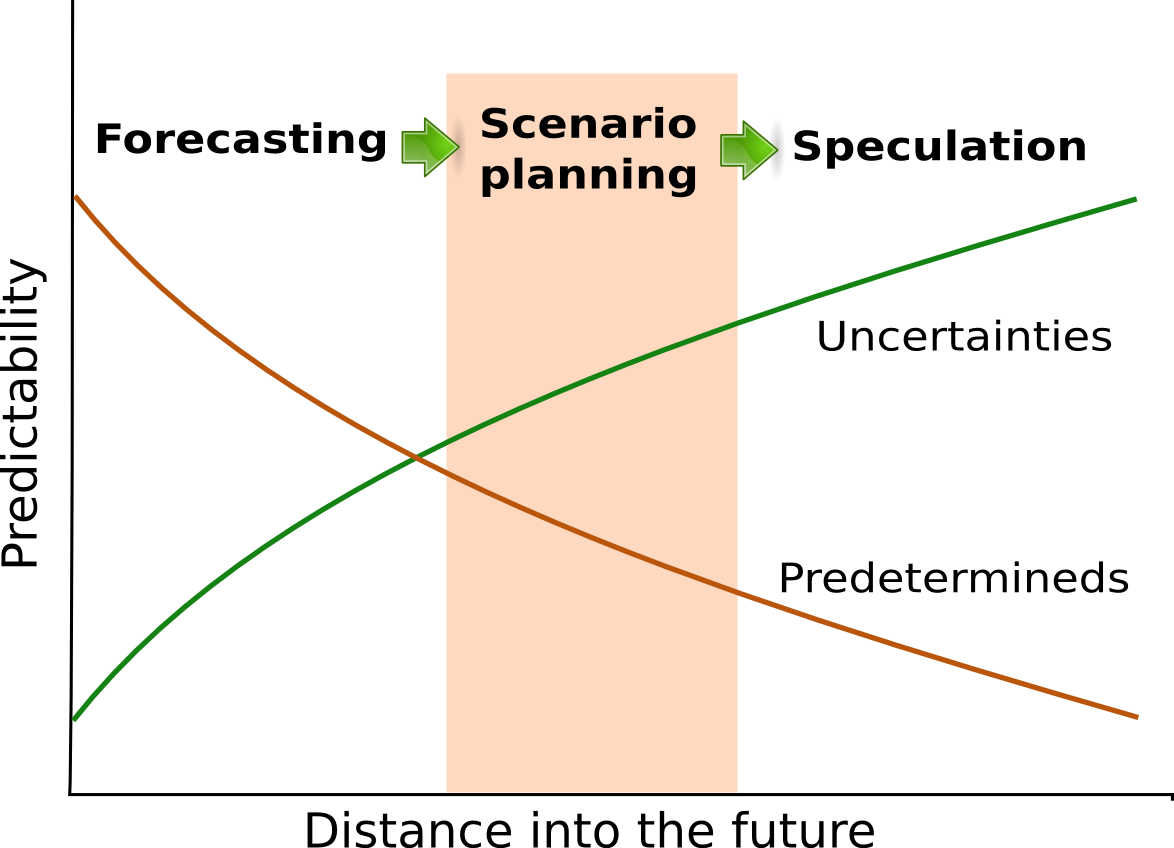
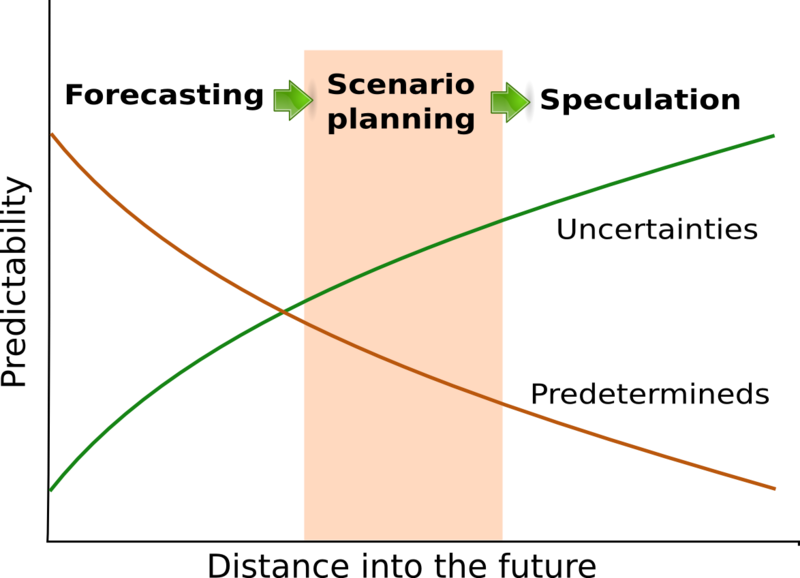
| Description | Figure adapted from Van der Heijden to illustrate the relationship between uncertainties and predetermines over time in scenario planning. |
|---|---|
| Source | Self generated graphic |
| Date | 2013-02-24 |
| Author | Wayne Mackintosh |
| Permission | See below. |
Licensing:
|
File history
Click on a date/time to view the file as it appeared at that time.
| Date/Time | Thumbnail | Dimensions | User | Comment | |
|---|---|---|---|---|---|
| current | 15:57, 25 February 2013 | | 1,174 × 848 (93 KB) | Mackiwg (Talk | contribs) | {{Information |Description=Figure adapted from Van der Heijden to illustrate the relationship between uncertainties and predetermines over time in scenario planning. |Source=Self generated graphic |Author=Wayne Mackintosh |Date=2013-02-24 |Permission= |ot |
- You cannot overwrite this file.
File usage
The following 2 pages link to this file: