Thermometers To Think About
| Instant wiki maker | Making handouts | Editing tips |
Contents
- 1 Student worthiness
- 2 Primary biological content area covered
- 3 Materials
- 4 Handouts
- 5 Description of activity
- 6 Lesson plan
- 7 Activity In Action
- 8 Potential pitfalls
- 9 Math connections
- 10 Literature connections
- 11 Connections to educational standards
- 12 Next steps
- 13 Reflections
- 14 Citations and links

Biology In Elementary Schools is a Saint Michael's College student project from a course that ran between 2007 and 2010 and fully described in this book chapter. The student-created resources have been preserved here for posterity. Link under 'toolbox' for printer-friendly versions of the exercises. Click on handouts to print full resolution versions. Please see Wikieducator's disclaimer, our safety statement, and the Creative Commons licensing in English and in legalese.
Student worthiness
Tested and Worked.
Primary biological content area covered
- Heat Transfer
Materials
Student Materials
- Water
- Red food coloring
- Plastic test tubes
- Plastic pipettes
- Rubber stopper with hole
Teacher Materials
- Large bowl of hot water
- Large bowl of cold water with ice
- Stopwatch
- Real thermometer
Handouts
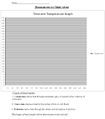
Figure 1. Student Handout (front)
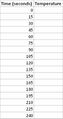
Figure 2. Student Handout (back)
Figure 3. Teacher Guide


Description of activity
To explore the topic of heat transfer, students will construct their own thermometers using test tubes, plastic pipettes, rubber stoppers, and red-colored water (See Figure 4 for finished product). The homemade thermometers will be placed in hot and cold water; the temperature change will be recorded in intervals of fifteen seconds and the data will be graphed by students. Students will learn how our "thermometers" work: the air enclosed in the test tube expands when heated and presses down on the water surface. The displaced water escapes into the straw and shows the degree of heating by its position.
Lesson plan
Pre-Activity Teacher Preparation
- Push each plastic pipette through a rubber stopper with hole. Do this so approximately 1/2 inch of the pipette extends from the rubber stopper.
- Construct an example thermometer by filling the test tube with water (colored red with food coloring) and placing the rubber stopper in the test tube.
- Calibrate this "Example" thermometer using a bowls of hot water and cold water and a real thermometer for reference. Mark the scale so students can do the same.
- Leave a bowl of cold water and ice along with a bowl of hot water out for student use.
Activity
- Have each student assemble their own thermometer by filling the test tube with red water and topping it with a rubber stopper (the pipette should already be through the stopper).
- Have students record "room temperature" in "time 0" on the table (See Figure 2).
- Students place their thermometers in the hot water bath and record the changing temperature every 15 seconds. (See Figures 7 and 9.)
- After two minutes have passed, have students move their thermometers to the cold water bath, continuing to take data every 15 seconds. (See Figure 6.)
- After three minutes, students remove their thermometers and place their hands around them. (See Figure 8.) Continue to record.
- Students now transfer their data to the blank graph (See Figure 1).
- Clean up!
Post-Activity Discussion and Follow-Up Questions
- As a group, discuss the relationship seen on the graph.
- Introduce terms like "positive" and "negative" slope. Have students point to their respective ranges on the graph.
- Just looking at their graphs, can students tell when the thermometer was placed in the hot water? Cold water? Held in their hands?
- How do our homemade thermometers work?
- The air enclosed in the small tube expands when your hands wrap around it (heat) and presses down on the red water surface. The displaced water escapes into the straw and shows the degree of heating by its position.
- Brainstorm situations in which thermometers are used.
- Pools
- Fevers
- Outdoors
Activity In Action
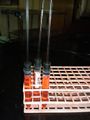
Figure 4. A few finished homemade thermometers.
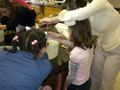
Figure 5. Callie helping students mark how much the water is dropping in the pipette.
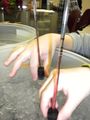
Figure 6. An up close view of some student's thermometers in an ice bath.
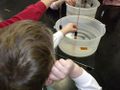
Figure 7. Students watching the water move up their pipettes in the hot water.
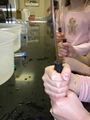
Figure 8. Students using their body heat to make the water rise in the pipette.
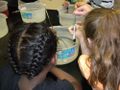
Figure 9. Students watching the water move up their pipette in the hot water.


Potential pitfalls
Minor mishaps may include:
- safety issues with the plastic pipettes
- water "spots" or "stripes" cause by air bubbles forming in the thermometer (not one continuous liquid that can be measured)
- difficulties or inaccuracies with calibration and scales
- when marking their pipettes, students might not all mark theirs at the correct time
- some students taking their thermometers out of the hot or cold water when they are supposed to be left in
- students holding their thermometers at an angle
- students holding their thermometers too low on the pipette so their hand temperatures might affect the water inside
Math connections
Students will:
- Demonstrate conceptual understanding and relative magnitude of whole numbers in respect to degrees of temperature.
- Practice and demonstrate the ability to measure temperature with pipettes.
- Practice and demonstrate the ability to graph data over time.
Literature connections
Cole, Joanna, and Bruce Degen. Scholastic's the Magic School Bus in the Arctic: a Book about Heat. New York: Scholastic, 1998. Print.
Emmett, Jonathan, and Vanessa Cabban. Diamond in the Snow. Cambridge, Mass: Candlewick, 2006. Print.
These books could be used to introduce the topic of heat and cold and physical change or to wrap up the activity and extend a conversation.
Connections to educational standards
This activity meets the following Vermont Standards:
1-2:9 Students demonstrate their understanding of the properties of physical matter by identifying, recording, and comparing characteristics of objects made of similar and different properties.
1-2:14 Students demonstrate their understanding of physical change by describing and reporting the change in properties when heat is applied to a solid or when heat leaves a liquid.
Next steps
After the completion of this activity, one could extend discussion in the direction to types of heat transfer (conduction, convection, and radiation). Students could be asked, "Why does this activity demonstrate conduction?" A class could also leave their homemade thermometers, once constructed, outside for a week and record the temperature each day (preferably a spring day, when temperatures are not extreme or freezing). This could be intertwined with "weather" units, the seasons, or simply a long-term math activity.
It is worth noting that water contracts until it reaches it's maximum density at 4 degrees Celsius. At temperatures colder than 4 degrees Celsius, water begins to expand once more. This is why water thermometers are not useful below 4 degrees and also why ice floats and out lakes freeze from the top rather than from the bottom. There may be a way to address this with this thermometer setup by using a rock salt and ice solution to reach colder temperatures and see if you can measure some expansion in the tube.
Reflections
Overall, I think this lesson was moderately successful. In terms of being "interesting" and "fun" to students, it was certainly a hit. Students enjoyed making their own thermometers and were genuinely excited to watch the level drop and rise when in the hot and cold baths. Before trying this again with second graders, though, it is evident that certain changes must be made. Most students knew the function of thermometers, but many were not familiar with Fahrenheit or Celsius scales. Our plan (as outlined above) had students organizing change in temperature first on a table and then on a graph. The second grade students, however, had never been exposed to graphs before, and many struggled with the concept of tables. Many "caught on" with the table idea with the close help of an adult. Perhaps this would be more beneficial for third or (definitely) fourth grade students. Also, if the table and graph elements were to be included, more time would be necessary-- perhaps thirty five to forty minutes rather than twenty five. Several elements of the activity should certainly remain. Before we finalized a plan for this activity, we debated over whether we (the teachers) should assemble the thermometers for students prior to the teaching time (we decided against it). It ultimately proved a good decision; when it came time for the real activity, students loved constructing their own thermometers and were excited to bring them home. All, in all, though, the activity is an engaging one for students and has a strong math connection-- a math connection that proved a little too advanced for second grade students but would work better with third or fourth grade. --Callie Lumbra
The "Thermometer to Think About" activity turned out to be successful after making minor adjustments during the lesson to fit the level of the students we were teaching. My group and I were thrilled that the students were so interested in making their very own thermometer. When we had the students place their homemade thermometers in the hot and cold baths, it was great to see the kid’s enthusiasm as the colored water rose up or dropped down the pipette. Having the students mark how much the temperature was rising or dropping proved to be entertaining and educational; they loved seeing the extreme difference between the hot and cold temperature marks on their pipettes. We ran into trouble when it came to real Celsius and Fahrenheit. Many of the students knew that these were used for measuring temperature but didn’t know how to make a degree symbol or what the difference between the two measurements is. The table and the graph we had originally planned on doing proved to be too complicated for these student’s levels. Perhaps if we were given more time to fully explain and teach a lesson on graphs and tables than the kids would have caught on, but in the 20 to 25 minutes we were allotted we could not provide this lesson. Instead of trying to teach the kids in the short time accepted the fact that the students had not learned some of this material and had them play more with their thermometer to see what it could do. If I could redo this lesson, I would modify the handout, making it simpler with no table or graph. I would recommend using this activity for a fourth grade class. -Laken Ferreira
This activity went well but we had to make some changes before it began to run smoothly. After the students made their thermometers (filled their plastic test tubes with water and food coloring, leaving an air pocket at the top, pushing a stopper into the top that had a plastic pipette snuggly inside it), they put the test tubes in warm water to heat up the air pocket which pushed the water up further into the pipette. Next we had them put the thermometers in cold water to cool the air pocket and pull the water back down. They marked the water level on the pipette every thirty seconds as it was going down. After their pipettes were marked we were at first having the students use math to figure out the temperature at each of their marks based on knowing that every two tick marks was three degrees Celsius. After only one or two groups we figured out that this was too advanced for the second graders. They could do it with significant help but it was taking way more time than we had and not allowing us enough time to discuss the main point of our activity, why and how the thermometers worked. We never even attempted the graph. As soon as we gave up on our handouts the activity was much more relaxed and enjoyable and he students got a lot more out of it. -Kerry Cyr
Citations and links
The idea for this activity was obtained from this source:
Science Experiments. New York: HJ Press, 1998.