Finding the slope between two points of a line
The slope of a line is commonly defined as rise over run. This reminds me of stairs on a staircase. The stairs are all built with a specific height (rise) and length (run), and the stairs help you to go from one point to another point on the staircase (the line). (More on this in a later section.) A line is comprised of infinitely many points, but we need only two points on the line to find the slope.
For any two points on a line, with coordinates [math](x_1,\, y_1)[/math] and [math](x_2,\, y_2)[/math] the formula for the slope, [math]m[/math], of the line is:
- [math]m = \frac{\text{rise}}{\text{run}} = \frac{y_2 - y_1}{x_2 - x_1}[/math]
Note that rise is the difference between the two y values of the points, and run is the difference between the two x values of the points.
Calculating the slope
To calculate the slope of a line, the first step is to identify two points on the line. Let's try some examples, given two specified points.
Example 1:
On the graph at right, two points are labeled on the green line:- [math](2,\, 6)[/math], which we'll label as point 1, corresponding to [math](x_1,\, y_1)[/math],
- [math](3,\, 9)[/math], which we'll label as point 2, corresponding to [math](x_2,\, y_2)[/math].
The slope of the line is:
[math]m = \frac{y_2 - y_1}{x_2 - x_1} = \frac{9 - 6}{3-2} = \frac{3}{1} = 3[/math]
Example 2:
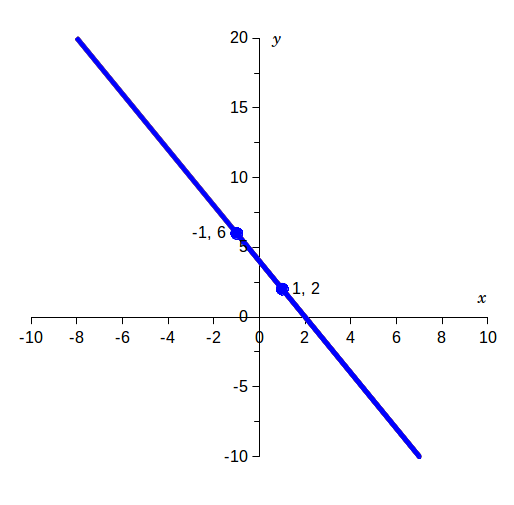
On the graph at right, two points are labeled on the blue line:- [math](-1,\, 6)[/math], which we'll label as point 1, corresponding to [math](x_1,\, y_1)[/math],
- [math](1,\, 2)[/math], which we'll label as point 2, corresponding to [math](x_2,\, y_2)[/math].
The slope of the line is:
[math]m = \frac{y_2 - y_1}{x_2 - x_1} = \frac{2 - 6}{1 - (-1)} = \frac{2 - 6}{1 + 1} = \frac{-4}{2} = -2[/math]
Example 3:
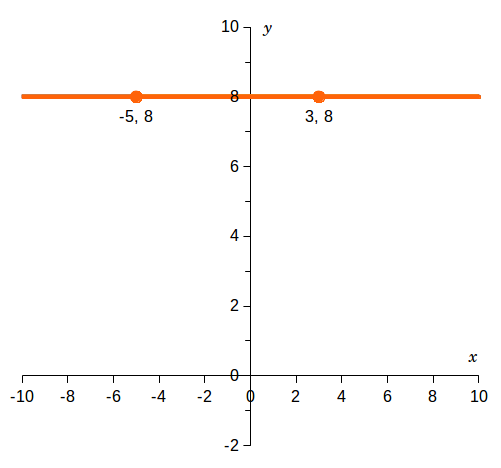
On the graph at right, two points are labeled on the blue line:- [math](-5,\, 8)[/math], which we'll label as point 1, corresponding to [math](x_1,\, y_1)[/math],
- [math](3,\, 8)[/math], which we'll label as point 2, corresponding to [math](x_2,\, y_2)[/math].
The slope of the line is:
[math]m = \frac{y_2 - y_1}{x_2 - x_1} = \frac{8 - 8}{3 - (-5)} = \frac{0}{3 + 5} = \frac{0}{8} = 0[/math]
Example 4:
On the graph at right, two points are labeled on the blue line:- [math](-3,\, -2)[/math], which we'll label as point 1, corresponding to [math](x_1,\, y_1)[/math],
- [math](-3,\, 4)[/math], which we'll label as point 2, corresponding to [math](x_2,\, y_2)[/math].
The slope of the line is:
[math]m = \frac{y_2 - y_1}{x_2 - x_1} = \frac{4 - (-2)}{-3 - (-3)} = \frac{4 + 2}{-3 + 3} = \frac{6}{0}[/math]
The slope, [math]m[/math], is undefined. This is because we cannot divide by 0. For example, there is no number that we can multiply 0 by to get 6.


