File:Mauna Loa CO2 monthly mean concentration.svg
From WikiEducator

Size of this preview: 600 × 600 pixels.
Original file (SVG file, nominally 708 × 708 pixels, file size: 434 KB)
Summary
| Description |
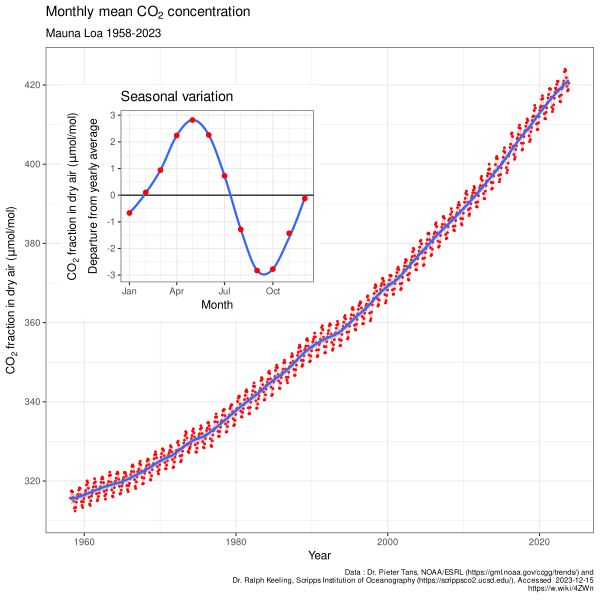
English: This figure shows the history of atmospheric carbon dioxide concentrations as directly measured at Mauna Loa, Hawaii since 1958. This curve is known as the Keeling curve, and is an essential piece of evidence of the man-made increases in greenhouse gases that are believed to be the cause of global warming. The longest such record exists at Mauna Loa, but these measurements have been independently confirmed at many other sites around the world [1].
The carbon dioxide data is measured as the mole fraction in dry air. This dataset constitutes the longest record of direct measurements of CO2 in the atmosphere (regularly updated).The annual fluctuation in carbon dioxide is caused by seasonal variations in carbon dioxide uptake by land plants. Since many more forests are concentrated in the Northern Hemisphere, more carbon dioxide is removed from the atmosphere during Northern Hemisphere summer than Southern Hemisphere summer. This annual cycle is shown in the inset figure by taking the average concentration for each month across all measured years. The red curve shows the average monthly concentrations, and blue curve is a smoothed trend. |
| Date | |
| Source | Own work. Data from Dr. Pieter Tans, NOAA/ESRL and Dr. Ralph Keeling, Scripps Institution of Oceanography. |
| Author | Oeneis |
| Other versions |
[]
Keeling curve
|


Create this plot
R code
# Mauna Loa atmospheric CO2 change
# multi language plot for Wikipedia
# using different possible sources (Scripps if NOAA is not available)
#
# Used for https://commons.wikimedia.org/wiki/File:Mauna_Loa_CO2_monthly_mean_concentration.svg
# and related files in other languages. See all files in :
# https://commons.wikimedia.org/wiki/Template:Other_versions/Mauna_Loa_CO2_monthly_mean_concentration
#
# Update this script on :
# https://commons.wikimedia.org/w/index.php?title=Template:Other_versions/Mauna_Loa_CO2_monthly_mean_concentration.R&action=edit

# Required packages.   used for :
library(readr)         # reading data
library(dplyr)         # data processing
library(ggplot2)       # plot
library(gridExtra)     # plot positionning
library(scales)        # pretty breaks on plot axis
library(lubridate)     # date processing
library(httr)          # check url
library(Hmisc)         # ci from bootstrap

# install all locales beforehand, e.g. :
# sudo locale-gen ca_ES.UTF-8

old_locale <- Sys.getlocale("LC_TIME")

# Translations ------------------------------------------------------------

language <- list(

  ca_ES = list(
    locale_lc_time = "ca_ES.UTF-8",
    title = bquote("Mitjana mensual de la concentratió de"~CO[2]),
    subtitle = "Mauna Loa",
    caption_scripps = paste("dades : R. F. Keeling, S. J. Walker, S. C. Piper and A. F. Bollenbacher\nScripps CO2 Program (https://scrippsco2.ucsd.edu/). Visitada", Sys.Date()),
    caption_noaa = paste("dades : Dr. Pieter Tans, NOAA/ESRL (https://gml.noaa.gov/ccgg/trends/) i\n Dr. Ralph Keeling, Scripps Institution of Oceanography (https://scrippsco2.ucsd.edu/). Visitada ", Sys.Date()),
    x = "any",
    y = bquote("fracció de"~CO[2]~"en aire sec ("*mu*"mol/mol)"),
    x2 = "mes",
    y2 = bquote(atop("fracció de"~CO[2]~"en aire sec ("*mu*"mol/mol)",
                     "desviació de la mitjana anual")),
    title2 = "Variació mensual"
  ),

  cs_CZ = list(
    locale_lc_time = "cs_CZ.UTF-8",
    title = "Průměrné měsíční koncentrace oxidu uhličitého",
    subtitle = "Mauna Loa",
    caption_scripps = paste("data : R. F. Keeling, S. J. Walker, S. C. Piper a A. F. Bollenbacher\nScripps CO2 Program (https://scrippsco2.ucsd.edu/). Přístupné", Sys.Date()),
    caption_noaa = paste("data : Dr. Pieter Tans, NOAA/ESRL (https://gml.noaa.gov/ccgg/trends/) a\nDr. Ralph Keeling, Scripps Institution of Oceanography (https://scrippsco2.ucsd.edu/). Přístupné", Sys.Date()),
    x = "rok",
    y = bquote("koncentrace"~CO[2]~"v suchém vzduchu ("*mu*"mol/mol)"),
    x2 = "měsíc",
    y2 = bquote(atop("koncentrace"~CO[2]~"v suchém vzduchu ("*mu*"mol/mol)", "odchylka od ročního průměru")),
    title2 = "Měsíční změna (průměrná roční odchylka)"
  ),

  de_DE = list(
    locale_lc_time = "de_DE.UTF-8",
    title = bquote("Monatliche durchschnittliche"~CO[2]*"-Konzentration"),
    subtitle = "Mauna Loa",
    caption_scripps = paste("Datei : R. F. Keeling, S. J. Walker, S. C. Piper und A. F. Bollenbacher\nScripps CO2 Program (https://scrippsco2.ucsd.edu/). Zugänglich am", Sys.Date()),
    caption_noaa = paste("Datei : Dr. Pieter Tans, NOAA/ESRL (https://gml.noaa.gov/ccgg/trends/) und\nDr. Ralph Keeling, Scripps Institution of Oceanography (https://scrippsco2.ucsd.edu/). Zugänglich am", Sys.Date()),
    x = "Jahr",
    y = bquote(CO[2]*"-Anteil in trockener Luft ("*mu*"mol/mol)"),
    x2 = "Monate",
    y2 = bquote(atop(CO[2]*"-Anteil in trockener Luft ("*mu*"mol/mol)", "Abweichung vom Jahresmittel")),
    title2 = "Monatliche Variation"
  ),

  en_US = list(
    locale_lc_time = "en_US.UTF-8",
    title = bquote("Monthly mean"~CO[2]~"concentration"),
    subtitle = "Mauna Loa",
    caption_scripps = paste("Data : R. F. Keeling, S. J. Walker, S. C. Piper and A. F. Bollenbacher\nScripps CO2 Program (https://scrippsco2.ucsd.edu/). Accessed", Sys.Date()),
    caption_noaa = paste("Data : Dr. Pieter Tans, NOAA/ESRL (https://gml.noaa.gov/ccgg/trends/) and\n Dr. Ralph Keeling, Scripps Institution of Oceanography (https://scrippsco2.ucsd.edu/). Accessed ", Sys.Date()),
    x = "Year",
    y = bquote(CO[2]~"fraction in dry air ("*mu*"mol/mol)"),
    x2 = "Month",
    y2 = bquote(atop(CO[2]~"fraction in dry air ("*mu*"mol/mol)", "Departure from yearly average")),
    title2 = "Seasonal variation"
  ),

  es_ES = list(
    locale_lc_time = "es_ES.UTF-8",
    title = bquote("Media mensual de la concentración de"~CO[2]),
    subtitle = "Mauna Loa",
    caption_scripps = paste("dato : R. F. Keeling, S. J. Walker, S. C. Piper y A. F. Bollenbacher\nScripps CO2 Program (https://scrippsco2.ucsd.edu/). Visitada", Sys.Date()),
    caption_noaa = paste("dato : Dr. Pieter Tans, NOAA/ESRL (https://gml.noaa.gov/ccgg/trends/) y\nDr. Ralph Keeling, Scripps Institution of Oceanography (https://scrippsco2.ucsd.edu/). Visitada", Sys.Date()),
    x = "Año",
    y = bquote("Fraccion de"~CO[2]~"en aire secco ("*mu*"mol/mol)"),
    x2 = "Mes",
    y2 = bquote(atop("Fraccion de"~CO[2]~"en aire secco ("*mu*"mol/mol)", "Desviación de la media anual")),
    title2 = "Variación mensual"
  ),

  fr_FR = list(
    locale_lc_time = "fr_FR.UTF-8",
    title = bquote("Moyenne mensuelle de la concentration de"~CO[2]),
    subtitle = "Mauna Loa",
    caption_scripps = paste("données : R. F. Keeling, S. J. Walker, S. C. Piper et A. F. Bollenbacher\nScripps CO2 Program (https://scrippsco2.ucsd.edu/). Accédé le", Sys.Date()),
    caption_noaa = paste("données : Dr Pieter Tans, NOAA/ESRL (https://gml.noaa.gov/ccgg/trends/) et\n Dr. Ralph Keeling, Scripps Institution of Oceanography (https://scrippsco2.ucsd.edu/). Accédé le", Sys.Date()),
    x = "année",
    y = bquote("fraction de"~CO[2]~"dans l'air sec ("*mu*"mol/mol)"),
    x2 = "mois",
    y2 = bquote(atop("fraction de"~CO[2]~"dans l'air sec ("*mu*"mol/mol)", "en écart à la moyenne annuelle")),
    title2 = "Variation saisonnière"
  ),

    nl_NL = list(
    locale_lc_time = "nl_NL.UTF-8",
    title = bquote("Maandelijkse gemiddelde"~CO[2]*"-concentratie"),
    subtitle = "Mauna Loa",
    caption_scripps = glue("Gegevens : R. F. Keeling, S. J. Walker, S. C. Piper en A. F. Bollenbacher\nScripps CO2 Program (https://scrippsco2.ucsd.edu/). Geopend {Sys.Date()}"),
    caption_noaa = glue("Gegevens : Dr. Pieter Tans, NOAA/ESRL (https://gml.noaa.gov/ccgg/trends/) en\n Dr. Ralph Keeling, Scripps Institution of Oceanography (https://scrippsco2.ucsd.edu/). Accessed  {Sys.Date()}"),
    x = "Jaar",
    y = bquote(CO[2]*"-fractie in droge lucht ("*mu*"mol/mol)"),
    x2 = "Mannd",
    y2 = bquote(atop(CO[2]*"-fractie in droge lucht ("*mu*"mol/mol)", "Afwijking van jaargemiddelde")),
    title2 = "Seizoensgebonden variatie"
  ),

  nn_NO = list(
    locale_lc_time = "nn_NO.UTF-8",
    title = bquote("Gjennomsnittlig månedlig"~CO[2]*"-konsentrasjon"),
    subtitle = "Mauna Loa",
    caption_scripps = paste("data : R. F. Keeling, S. J. Walker, S. C. Piper og A. F. Bollenbacher\nScripps CO2 Program (https://scrippsco2.ucsd.edu/). Vist", Sys.Date()),
    caption_noaa = paste("data : Dr. Pieter Tans, NOAA/ESRL (https://gml.noaa.gov/ccgg/trends/) og\nDr. Ralph Keeling, Scripps Institution of Oceanography (https://scrippsco2.ucsd.edu/). Vist", Sys.Date()),
    x = "År",
    y = bquote(CO[2]*"-andel i tørr luft ("*mu*"mol/mol)"),
    x2 = "Måned",
    y2 = bquote(atop(CO[2]*"-andel i tørr luft ("*mu*"mol/mol)",
                     "Avvik fra årlig gjennomsnitt")),
    title2 = "Årlig variasjon"
  ),

  pl_PL = list(
    locale_lc_time = "pl_PL.UTF-8",
    title = bquote("Średnie miesięczne stężenie"~CO[2]),
    subtitle = "Mauna Loa",
    caption_scripps = paste("Dane : R. F. Keeling, S. J. Walker, S. C. Piper i A. F. Bollenbacher\nScripps CO2 Program (https://scrippsco2.ucsd.edu/). Dostęp na", Sys.Date()),
    caption_noaa = paste("Dane : Dr. Pieter Tans, NOAA/ESRL (https://gml.noaa.gov/ccgg/trends/) i\nDr. Ralph Keeling, Scripps Institution of Oceanography (https://scrippsco2.ucsd.edu/). Dostęp na", Sys.Date()),
    x = "Rok",
    y = bquote("Frakcja"~CO[2]~"w suchym powietrzu ("*mu*"mol/mol)"),
    x2 = "Miesiąc",
    y2 = bquote(atop("Frakcja"~CO[2]~"w suchym powietrzu ("*mu*"mol/mol)", "Odejście od średniej rocznej")),
    title2 = "Wahania sezonowe"
  ),

  ro_RO = list(
    locale_lc_time = "ro_RO.UTF-8",
    title = bquote("Concentrația medie lunară de"~CO[2]),
    subtitle = "Mauna Loa, Hawaii",
    caption_scripps = paste("Date: R. F. Keeling, S. J. Walker, S. C. Piper și A. F. Bollenbacher\nScripps CO2 Program (https://scrippsco2.ucsd.edu/). Accesat în", Sys.Date()),
    caption_noaa = paste("Date : Dr. Pieter Tans, NOAA/ESRL (https://gml.noaa.gov/ccgg/trends/) și\n Dr. Ralph Keeling, Scripps Institution of Oceanography (https://scrippsco2.ucsd.edu/). Accesat în", Sys.Date()),
    x = "An",
    y = bquote("Ponderea"~CO[2]~"în aer uscat ("*mu*"mol/mol)"),
    x2 = "Lună",
    y2 = bquote(atop("Abaterea cotei"~CO[2]~"în aer uscat ("*mu*"mol/mol)", "Abatere de la media anuală")),
    title2 = "Variație sezonieră"
  ),

  ru_RU = list(
    locale_lc_time = "ru_RU.UTF-8",
    title = bquote("Среднемесячная и среднегодовая концентрации"~CO[2]),
    subtitle = "Мауна Лоа, Гаваи",
    caption_scripps = paste("данные : R. F. Keeling, S. J. Walker, S. C. Piper и A. F. Bollenbacher\nScripps CO2 Program (https://scrippsco2.ucsd.edu/). доступ на", Sys.Date()),
    caption_noaa = paste("данные : Dr. Pieter Tans, NOAA/ESRL (https://gml.noaa.gov/ccgg/trends/) и\nDr. Ralph Keeling, Scripps Institution of Oceanography (https://scrippsco2.ucsd.edu/). доступ на ", Sys.Date()),
    x = "Годы",
    y = bquote("Доля"~CO[2]~"в сухом воздухе ("*mu*"mol/mol)"),
    x2 = "Месяцы",
    y2 = bquote(atop("Отклонение доли"~CO[2]~"в сухом воздухе", "от среднегодового значения, мкмоль/моль")),
    title2 = "Сезонные колебания"
  )

)


# Data --------------------------------------------------------------------

# First try NOAA data, if not availble use Scripps data
if (!http_error("ftp://aftp.cmdl.noaa.gov/products/trends/co2/co2_mm_mlo.txt")) {
  # https://gml.noaa.gov/ccgg/trends/data.html
  source <- "noaa"
  co2ml <- read_table(
    "ftp://aftp.cmdl.noaa.gov/products/trends/co2/co2_mm_mlo.txt",
    col_names = c("year", "month", "decimal", "average", "deseason", "ndays", "stddays", "unc"),
    col_types = "iidddidd",
    na = c("-99.99", "-1"),
    comment = "#") %>%
    group_by(year) %>%
    mutate(year_mean = mean(average, na.rm = TRUE),
           delta = average - year_mean,
           vdate = ymd(paste0("2015-", month, "-01")))%>%
    rename(co2 = average)

} else {
  # https://scrippsco2.ucsd.edu/data/atmospheric_co2/primary_mlo_co2_record
  # used during US gov shutdown
  source <- "scripps"
  co2ml <- read_csv(
    "https://scrippsco2.ucsd.edu/assets/data/atmospheric/stations/in_situ_co2/monthly/monthly_in_situ_co2_mlo.csv",
    col_names = c("year", "month", "xls_date", "decimal",
                  "co2_raw", "co2_raw_seas_adj", "fit", "fit_seas_adj",
                  "co2_filled", "co2_filled_seas_adj"),
    col_types = "iiiddddddd",
    skip = 57,
    na = "-99.99",
    comment = "\"") %>%
    group_by(year) %>%
    mutate(year_mean = mean(co2_filled, na.rm = TRUE),
           delta = co2_filled - year_mean,
           vdate = ymd(paste0("2015-", month, "-01"))) %>%
    rename(co2 = co2_filled)
}


# Generate the plot for each language -------------------------------------

for (l in names(language)) {
  message(l)
  current <- language[[l]]

  # format the date in local names
  Sys.setlocale("LC_TIME", current$locale_lc_time)

  # main plot
  p1 <- ggplot(co2ml, aes(decimal, co2)) +
    geom_line(color = "pink") +
    geom_point(color = "red", size = 0.6) +
    stat_smooth(span = 0.1) +
    scale_x_continuous(breaks = pretty_breaks()) +
    scale_y_continuous(breaks = pretty_breaks()) +
    labs(x = current$x,
         y = current$y,
         title = current$title,
         subtitle = paste(current$subtitle, min(co2ml$year), "-", max(co2ml$year)),
         caption = paste(current[[paste0("caption_", source)]],
                         "https://w.wiki/4ZWn", sep = "\n")) +
    theme_bw() +
    theme(plot.caption = element_text(size = 7))

  # inset plot
  p2 <- ggplot(co2ml, aes(vdate, delta)) +
    geom_hline(yintercept = 0) +
    stat_smooth(span = 0.4, se = FALSE) +
    stat_summary(fun.data = "mean_cl_boot", colour = "red", size = 0.3) +
    scale_x_date(breaks = pretty_breaks(4),
                 minor_breaks = pretty_breaks(12),
                 labels = date_format("%b")) +
    labs(x = current$x2,
         y = current$y2,
         title = current$title2) +
    theme_bw()

  # merge the plots and export in SVG
  p1 + annotation_custom(grob = ggplotGrob(p2),
                         xmin = 1957, xmax = 1991, ymin = 361, ymax = 420)

  ggsave(file = paste("co2_mauna_loa", l, Sys.Date(), "wp.svg", sep = "_"),
         width = 20,
         height = 20,
         units = "cm",
         device = svg)
}

# return to former locale
Sys.setlocale("LC_TIME", old_locale)
| Object location | | View this and other nearby images on: OpenStreetMap |
|---|
Licensing
I, the copyright holder of this work, hereby publish it under the following license:
This file is licensed under the Creative Commons Attribution-Share Alike 4.0 International license.
- You are free:
- to share – to copy, distribute and transmit the work
- to remix – to adapt the work
- Under the following conditions:
- attribution – You must give appropriate credit, provide a link to the license, and indicate if changes were made. You may do so in any reasonable manner, but not in any way that suggests the licensor endorses you or your use.
- share alike – If you remix, transform, or build upon the material, you must distribute your contributions under the same or compatible license as the original.
Data source license
These data are made freely available to the public and the scientific community in the belief that their wide dissemination will lead to greater understanding and new scientific insights.
— Pieter Tans, in: NOAA
File history
Click on a date/time to view the file as it appeared at that time.
| Date/Time | Thumbnail | Dimensions | User | Comment | |
|---|---|---|---|---|---|
| current | 07:49, 16 December 2023 | | 708 × 708 (434 KB) | Oeneis | update 2023 |
File usage
The following page links to this file: