File:Map-Anomaly-Mar-2017.png
From WikiEducator
No higher resolution available.
Map-Anomaly-Mar-2017.png (756 × 488 pixels, file size: 95 KB, MIME type: image/png)
Summary
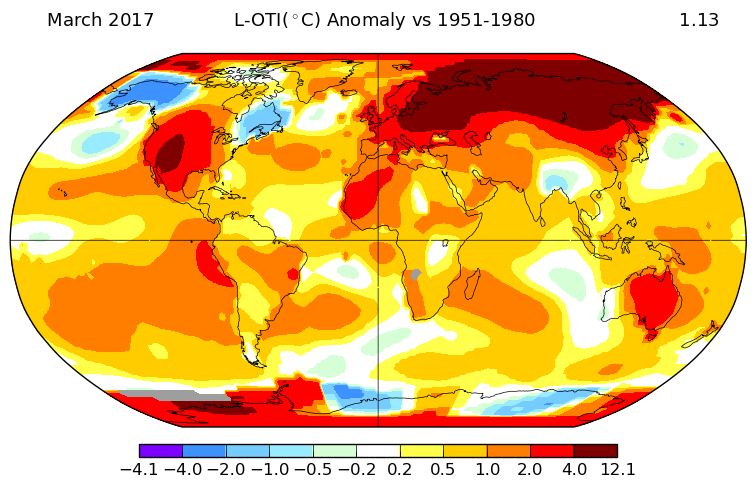
| Description | Map of temperature anomaly in March, 2017. Red color indicates the greatest temperature anomaly.] |
|---|---|
| Source | https://data.giss.nasa.gov/gistemp/maps/ |
| Date | 2017-05-20 00:31:14 |
| Author | NASA |
| Permission | See below. |
Licensing
| |
This file is in the public domain because it was created by NASA. NASA copyright policy states that "NASA material is not protected by copyright unless noted". (See Template:PD-USGov, NASA copyright policy page or JPL Image Use Policy.)
Boarisch | беларуская (тарашкевіца) | català | Deutsch | Ελληνικά | English | Esperanto | español | eesti | suomi | français | Gaeilge | galego | עברית | Հայերեն | italiano | 한국어 | lietuvių | македонски | മലയാളം | Plattdüütsch | Nederlands | polski | português | română | русский | ไทย | vèneto | 中文 | 中文(简体) | 中文(繁體) | +/− |
|
 |
Warnings:
|
File history
Click on a date/time to view the file as it appeared at that time.
| Date/Time | Thumbnail | Dimensions | User | Comment | |
|---|---|---|---|---|---|
| current | 05:32, 20 May 2017 | | 756 × 488 (95 KB) | JohnWS (Talk | contribs) | User created page with UploadWizard |
- You cannot overwrite this file.
File usage
There are no pages that link to this file.