Describing distributions with numbers/Self-check assessment
Use the following quiz questions to check your understanding of how to use numbers to better understand statistical data. Note that as soon as you have indicated your response, the question is scored and feedback is provided. As feedback is provided for each option, you may find it useful to try all of the responses (both correct and incorrect) to read the feedback, as a way to better understand the concept.
Measuring center
- Jane's test scores on her five tests are 90, 87, 70, 97, and 75. Her teacher is going to take the median of the test grades to calculate her final grade. Jane thinks she can argue and get two points back on some of the tests. Which test score(s) should she argue?[1]
- 90
- That's not quite right. The median is the midpoint of a distribution of scores. As this distribution has only 5 values, the median is the score for which two other scores are higher and two are lower. Try again.
- 87
- That's correct. If the teacher is going to use the median as the final grade, Jane should only argue for extra points for the middle score (87). Changing the other scores by 2 points would not affect the median.
- 70
- That's not quite right. The median is the midpoint of a distribution of scores. As this distribution has only 5 values, the median is the score for which two other scores are higher and two are lower. Try again.
- 97
- That's not quite right. The median is the midpoint of a distribution of scores. As this distribution has only 5 values, the median is the score for which two other scores are higher and two are lower. Try again.
- 90 and 75
- That's not quite right. The median is the midpoint of a distribution of scores. As this distribution has only 5 values, the median is the score for which two other scores are higher and two are lower. Try again.
- As many as she can
- That's not quite right. The median is the midpoint of a distribution of scores; to focus her efforts Jane could argue for extra points for only the test which will be the median score. As this distribution has only 5 values, the median is the score for which two other scores are higher and two are lower. Try again.
- 90
- When are the mean and the median the same?[2]
- When the distribution is very large
- That's not quite right. The amount of data (number of observations) in the distribution typically does not have a substantial impact on the mean and median, as the shape of the distribution would be similar (assuming the data in each instance are from the same population). Try again.
- When the distribution is symmetric
- That's correct. The mean and the median are only the same when a distribution is symmetric. The mean and median are different when the distribution is skewed.
- When the distribution is skewed
- That's not quite right. Think about how extreme values in the upper or lower tail affect the mean, but because the median is just the midpoint of the distribution it is unchanged when extreme values are present. Try again.
- When the distribution is symmetric, unimodal, but never when it's symmetric, bimodal
- That's not quite right. If the distribution is symmetric, then the data values smaller and larger than the midpoint are mirror images of each other. The fact that it's bimodal doesn't change this fact. Try again.
- Never
- That's not quite right. It is possible for the mean (the average value) and the median (the middle value) to be the same. Think about what characteristics of the distribution are necessary for this to be true. Try again.
- When the distribution is very large
- When a distribution is skewed to the right, what is the relationship between the median and the mean?[3]
- The mean is greater than the median.
- That's correct. A distribution that is skewed to the right has a longer tail to the right of the distribution, and the mean is higher than the median.
- The mean is less than the median.
- That's not quite right. A distribution that is skewed to the right has a longer tail to the right of the distribution. Think about how the much larger values (the ones on the right) affect the mean (average value) versus the median (middle value). Try again.
- The mean and median are about the same.
- That's not quite right. The mean is equal to the median when the distribution is symmetric. A distribution that is skewed to the right has a longer tail to the right of the distribution. Think about how the much larger values (the ones on the right) affect the mean (average value) as compared to the median (middle value). Try again.
- The mean is greater than the median.
- A survey collects the age at retirement for a random sample of 1,000 US adults. What will be the relationship between the mean and the median of the collected data?
- The mean will be greater than the median.
- That's not quite right. Think about what kind of distribution best represents the distribution of ages. Hint: Most adults retire in their 60's or later, with fewer people retiring earlier. Try again.
- The mean will be less than the median.
- That's correct. As most adults retire in their 60's or later, with fewer people retiring earlier (increasingly fewer as age decreases), the distribution is skewed to the left. The extreme low scores will impact the mean (making it smaller), but not the median.
- The mean and median will be about the same.
- That's not quite right. Think about what kind of distribution best represents the distribution of ages. Hint: Most adults retire in their 60's or later, with fewer people retiring earlier. Try again.
- The mean will be greater than the median.
Measuring spread
- A survey asked adults 18-25 how much time they spend on the internet. The resulting five-number summary is min=0, Q1=2.5, Median=4, Q3=7, max=13. Should the largest observation in the dataset be classified as an outlier?
- Yes
- That's not quite right. The IQR is 7 - 2.4 = 4.5. Using the 1.5 x IQR rule for identifying outliers, we calculate that Q3 + (1.5 * IQR) = 7 + (1.5 * 4.5) = 7 + 6.75 = 13.75. As the max (largest observation) is 13, which is less than 13.75, it should NOT be considered an outlier. The min, with a value of 0--only 2 points below Q1, is also not an outlier.
- No
- That's correct. The IQR is 7 - 2.4 = 4.5. Using the 1.5 x IQR rule for identifying outliers, we calculate that Q3 + (1.5 * IQR) = 7 + (1.5 * 4.5) = 7 + 6.75 = 13.75. As the max (largest observation) is 13, which is less than 13.75, it should NOT be considered an outlier. The min, with a value of 0--only 2 points below Q1, is also not an outlier.
- Yes
http://onlinestatbook.com/2/graphing_distributions/boxplotqa.gif
Use the boxplot shown above to answer questions 2-5.[4]
- Which letter labels Q3?
- C
- That's not quite right. C labels the maximum.
- D
- That's correct. D (the top of the box) labels Q3, the 75th percentile.
- F
- That's not quite right. F labels the median.
- G
- That's not quite right. G labels Q1, the 25th percentile.
- C
- Which letter labels the median?
- D
- That's not quite right. D labels Q3, the 75th percentile.
- E
- That's not quite right. E labels the mean of the distribution, which many software programs optionally include.
- F
- That's correct. F (the line which splits the box into two parts, upper and lower) labels the median.
- G
- That's not quite right. G labels Q1, the 25th percentile.
- D
- The IQR is represented by what interval?
- A-H
- That's not quite right. The A-H interval is the range, the difference between the maximum and minimum values. Recall that the IQR is the middle 50% of the distribution. Try again.
- D-G
- That's correct. The IQR (inter-quartile range) is the interval between the 25th percentile and the 75th percentile. It is the middle 50% of the distribution.
- E-F
- That's not quite right. The E-F interval is the difference between the mean and the median. Recall that the IQR is the middle 50% of the distribution. Try again.
- A-H
- Which of the following are true? (check all that apply.)
- The median is higher than the mean.
- That's not quite right. Note that E (the mean) is slightly higher than F (the median).
- There is one outlier.
- That's correct. There is one outlier in the graph, at A.
- The lowest value is H.
- That's correct. As there are no low outliers, the lowest data value is at H.
- The number of observations between D and F is less than between F and G.
- That's not quite right. The upper and lower parts of the central box each contain 25% of the data, the interval from D to F is smaller, as these data points are more bunched together.
- The highest value is C.
- That's not correct. The outlier at A has a higher value than C.
- The median is higher than the mean.
http://onlinestatbook.com/2/graphing_distributions/graphics/figure3.jpg
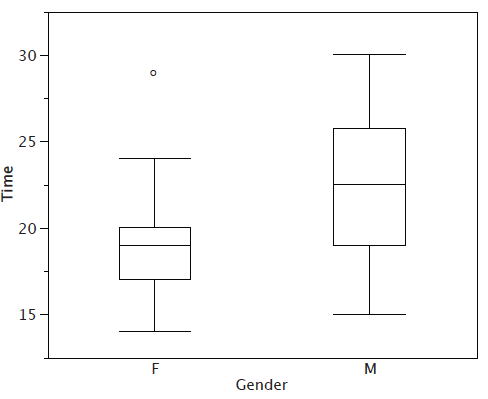
Students in an Introductory Statistics class were presented with a page containing 30 colored rectangles. Their task was to name the colors as quickly as possible. Their times (in seconds) were recorded. Side-by-side boxplots, shown above, display the distribution of times for the 16 men and 31 women who participated in the experiment.[5] Use the graph to answer the next 2 questions.
- 50% of the women have times greater than
- 17
- That's not quite right. 17 is Q1; 75% of the women had times greater than 17. Try again.
- 19
- That's correct. 19 is the median, which splits the distribution into two parts each containing 50% of the data.
- 20
- That's not quite right. 20 is Q3; 25% of the women had times greater than 20. Try again.
- Impossible to tell
- That's not quite right. The median splits the distribution into two parts each containing 50% of the data. Find the median line and then estimate it's time value from the y-axis. Try again.
- 17
- Within which time interval would you expect to find the largest number of women?
- 15-17.5
- That's not quite right. In answering this question it is useful to note that 25% of the data fall below Q1 (17), 25% of the data fall between Q1 (17) and the median (19), 25% of the data fall between the median (19) and Q3 (20), and 25% of the data fall above Q3 (20). As the minimum is less than 15, and 17.5 is only slightly greater than Q1 (17), we expect only slightly more than 25% of the observations in this interval. Try again.
- 17.5-20
- That's correct. As 17.5 is only slightly greater than Q1 (17) and 20 is Q3, this interval contains just shy of the full 50% of the observations. Using similar reasoning, we would expect 30% or fewer observations in the other intervals.
- 20-22.5
- That's not quite right. In answering this question it is useful to note that 25% of the data fall below Q1 (17), 25% of the data fall between Q1 (17) and the median (19), 25% of the data fall between the median (19) and Q3 (20), and 25% of the data fall above Q3 (20). As Q3 is 20 and the maximum point is 29, the interval 20-29 includes 25% of the observations, so the interval 20-22.5 must include less then 25%. Try again.
- 22.5-25
- That's not quite right. In answering this question it is useful to note that 25% of the data fall below Q1 (17), 25% of the data fall between Q1 (17) and the median (19), 25% of the data fall between the median (19) and Q3 (20), and 25% of the data fall above Q3 (20). As Q3 is 20 and the maximum point is 29, the interval 20-29 includes 25% of the observations, so the interval 22.5-25 must include less then 25%. Try again.
- 25-30
- That's not quite right. Although 25-30 is the largest time interval, it includes the smallest percentage of the observations, as only the one data point at 29 is included. Try again.
- 15-17.5
- The ages of best actor Oscar winners (1970-2001) range from 31 to 76. If the 4 observations greater than 60 are deleted, what will happen to the value of the standard deviation?[6]
- It will become larger.
- That's not quite right. Recall that the standard deviation is a measure of spread. If the largest 4 observations are removed, how does the spread of the distribution change? Try again.
- It will become smaller.
- That's correct. When the 4 largest observations are removed from the data, the variability in the data decreases. The standard deviation with all 32 ages included is sd = 10.3. With the 4 observations removed (n=28) the standard deviation is noticeably smaller, sd = 7.0.
- Not enough information to answer the question.
- That's not quite right. Recall that the standard deviation is a measure of spread. If the largest 4 observations are removed, how does the spread of the distribution change? Try again.
- It will not change.
- That's not quite right. Recall that the standard deviation is a measure of spread. If the largest 4 observations are removed, how does the spread of the distribution change? Try again.
- It will become larger.
- Suppose that in a certain country, the average yearly income for 75% of the population is below average, what would you use as the measure of center and spread?[7]
- Mean and standard deviation
- That's not quite right. In the description of the data, we note that 75% of the observations are less than the average (or mean), which suggests that the distribution is skewed to the right. As the mean and standard deviation are not resistant to extreme values, they are not recommended for use with skewed distributions. Try again.
- Mean and interquartile range
- That's not quite right. In the description of the data, we note that 75% of the observations are less than the average (or mean), which suggests that the distribution is skewed to the right. The mean is recommended for use with only symmetric distributions, which are free of outliers. Try again.
- Median and interquartile range
- That's correct. The description of the data suggest it is not symmetric, which means that the median and IQR are the preferred measures of center and spread.
- Median and standard deviation
- That's not quite right. In the description of the data, we note that 75% of the observations are less than the average (or mean), which suggests that the distribution is skewed to the right. The standard deviation is recommended for use with only symmetric distributions, which are free of outliers. Try again.
- Mean and standard deviation
- In what ways does the standard deviation intuitively fit with the idea that it's the average (or typical) distance between the data points and the mean? nnn
| Enter Feedback here |
Notes
- ↑ Question adapted from Measures of Central Tendency at Online Statistics Education: An Interactive Multimedia Course of Study. Project Leader: David M. Lane, Rice University. Retrieved 28 August 2012.
- ↑ Question adapted from Median and mean at Online Statistics Education: An Interactive Multimedia Course of Study. Project Leader: David M. Lane, Rice University. Retrieved 28 August 2012.
- ↑ Adapted from Comparing Measures of Central Tendency at Online Statistics Education: An Interactive Multimedia Course of Study. Project Leader: David M. Lane, Rice University. Retrieved 28 August 2012.
- ↑ Questions adapted from Box Plots at Online Statistics Education: An Interactive Multimedia Course of Study. Project Leader: David M. Lane, Rice University. Retrieved 28 August 2012.
- ↑ Adapted from Box Plots at Online Statistics Education: An Interactive Multimedia Course of Study. Project Leader: David M. Lane, Rice University. Retrieved 28 August 2012.
- ↑ Question adapted from Ebook Problem Set - Measures of Variation, Problem 3 in Probability and Statistics EBook, from UCLA Statistics Online Computational Resource (SOCR), Retrieved 29 August 2012.
- ↑ Question adapted from Ebook Problem Set - Measures of Variation, Problem 7 in Probability and Statistics EBook, from UCLA Statistics Online Computational Resource (SOCR), Retrieved 28 August 2012.