Come fly with me/Grades 7,8,9/EARTH SCIENCE - Activities 45 - 67
Come Fly With Me! - Exploring science through aviation / aerospace concepts
- David C. Housel and Doreen K.M. Housel, 1983.
- Reproduced with permission
EARTH SCIENCE
"...to see ourselves as riders on the earth together, brothers on that bright loneliness in the eternal cold." -- Archibaid MacLeish
Contents
- 1 EARTH SCIENCE OBJECTIVES
- 1.1 45. EXPLORING SOLAR CELLS
- 1.2 46. LET IT SHINE
- 1.3 47. WARM ALL OVER
- 1.4 48. WHERE ON THE WORLD ARE WE
- 1.5 49. LONGITUDE AND LATITUDE
- 1.6 50. MAPPING A PLANET'S MAGNETIC FIELD
- 1.7 51. WEIGHTLESS
- 1.8 52. DETECTING RADIATION
- 1.9 53. DON'T LET THE STARS GET IN YOUR EYES
- 1.10 54. "ROY G. BIV"
- 1.11 55. INTERPRETING SATELLITE DATA
- 1.12 56. TILT!
- 1.13 57. WEATHER FRONTS MOVE
- 1.14 58. READING AND PLOTTING WEATHER DATA
- 1.15 59. ASTRONOMICAL UNIT
- 1.16 60. PARALLAX ONE
- 1.17 61. PARALLAX TWO
- 1.18 62. RADIO TELESCOPES
- 1.19 63. A TRIP TO THE PLANETS
- 1.20 64. LUNAR CRATER DEMONSTRATION
- 1.21 65. HOW LONG 'TIL WE GET THERE?
- 1.22 66. COMETS
- 1.23 67. WHAT THE ROCKS TELL US
EARTH SCIENCE OBJECTIVES
- to understand the importance of satellites and space probes as means of obtaining information about our environment.
- to gain a basic knowledge of the techniques used by scientists to gather and interpret data from satellites.
- to gain a basic understanding of our solar system.
- to understand that certain environmental conditions in space make it necessary to investigate with robot probes rather than with human beings.
45. EXPLORING SOLAR CELLS
SUBJECT:
Science
GRADE:
7,8,9
GROUP SIZE:
Small
TIME:
60 minutes
TYPE OF ACTIVITY:
Student Investigation
TEACHING STRATEGY:
Guided Discovery Expository
CONCEPTS:
Solar Energy Solar Cell Solar Transmission
SKILLS:
Hypothesizing Collecting Data Interpreting Data
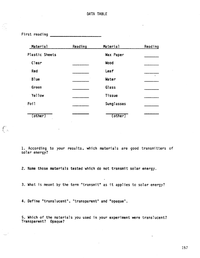
Objectives: To demonstrate that solar energy passes through some materials and not through others; to compare the amount of electricity produced by a solar cell when light is passed through different materials in front of the cell; to identify and hypothesize how certain materials are able to transmit solar energy and others are not.
Materials: A solar cell; milli-ammeter or galvanometer; 5cm squares of plastic sheets in several colors - red, blue, yellow, green; wax paper; glass; tissue; foil; a pair of sun glasses; cardboard; wood; a leaf; container of water; any other material you wish to include; a 200 watt bulb with reflector or spotlight in case the sun is not shining; (Optional - a pyranometer which measures the amount of light being absorbed at any given time - to be used in place of the miliammeter); activity sheet.
Procedure:
- Hook up your solar cell to the meter you have available. Position the solar cell facing the sun or the lamp so that you get the maximum reading on your meter.
- Record the reading on the table from the activity sheet.
- Test and record readings while using all of the other materials in turn.
- Have the students rank the materials from best transmitter of solar energy to worst.
- Have the students hypothesize about what must be true of a material to be a good transmitter of solar energy.
Extensions:
Have the students identify and control any variables in their experiments which they may not have taken into account during the first try. Did results change? Try combinations of materials and compare these results with the first experiment. Compare the results with experiments on heat absorption by different colored materials. Have the students research the uses of solar power in spacecraft. Find information on the proposed projection of solar power to the earth by microwave from collectors in space. Read about the Gossamer Albatross solar powered plane and get a film about it from NASA.
Adapted from Dept. of Energy, CS-0062, SOLAR ENERGY PROJECT ACTIVITIES. JR, HIGH SCIENCE
46. LET IT SHINE
SUBJECT:
Science
GRADE:
7,8,9
GROUP SIZE: Large or Small
TIME:
60 minutes
TYPE OF ACTIVITY:
Student Investigation or Teacher Demo
TEACHING STRATEGY:
Guided Discovery Expository
CONCEPTS:
Solar Radiation Radiometer Energy Absorption
SKILLS:
Observation Inference Collecting Data
Objectives: To distinguish between the presence and absence of solar energy by means of a radiometer; to observe and describe the effects of low and high amounts of solar energy on a radiometer; to demonstrate that solar radiation can do work.
Materials: Paddle type radiometer (at least one or as many as one for every two students); squares of different material 30cm on a side (black paper, cardboard, cellophane in several colors); can or oatmeal container large enough to fit over the radiometer.
Teacher Background Information:
The atmosphere inside a radiometer is a partial vacuum. With many of the molecules of air removed from inside the globe, those left can move about much more freely than those outside the radiometer. Each paddle inside the radiometer has a dark and a light colored side. The dark side of the paddle absorbs more heat energy than the light side. As molecules of air strike the dark side they pick up much more energy than those striking the light side. The result is that the molecules kick away from the dark side and cause a reaction in the opposite direction propelling the paddles. Check online for additional information.
Procedure:
- Have the students examine the radiometer for several minutes before you begin.
- Place the radiometer on a desk or table in the sunlight and have the students observe and record what happens.
- Place different squares of material in front of the radiometer and record the observations again.
- Place a container over the radiometer and remove it after several minutes. Record what you observe about the radiometer immediately after it was uncovered.
What happened when the radiometer was placed in the sun? When it was shaded with different materials? When it was covered? In which direction did the paddles spin? How does the radiometer detect solar energy? How does the radiometer demonstrate that sunlight can do work?
Extensions:
Use a light source like a slide projector and shine the light at different angles on the radiometer. Record the rotation rate of the radiometer at different angles. Relate this to the angle of the sun at different times of the year in relationship to the earth. At what angle was the rotation rate the greatest? The slowest?
At what angle, in your area, would it be best to place a solar collector in relationship to the sun? At what time of the year would your collector be the most efficient? If you were going to use solar collectors on a space vehicle (for electricity or propulsion), what provisions for the relationship of the collectors to the sun would you make? Could you use the solar energy demonstrated by the radiometer to propel a space vehicle? Why or why not?
Adapted from Dept. of Energy, CS-0062, SOLAR ENERGY PROJECT ACTIVITIES, JR. HIGH SCIENCE
47. WARM ALL OVER
SUBJECT:
Science
GRADE:
7,8,9
GROUP SIZE:
Small or Large
TIME:
60 minutes
TYPE OF ACTIVITY:
Teacher Demo or Student Investigation
TEACHING STRATEGY:
Guided Discovery Discussion
CONCEPTS:
Radiant Energy Solar Radiation Electromagnetic Energy
SKILLS:
Experimentation Interpreting Data Recording Data
Objectives: To investigate the rate at which different colored materials absorb heat; to investigate the rate at which different colored materials radiate heat; to be able to select a color which would be the best collector of heat and a color which would be the best radiator.
Materials: A radiant heat source (heat lamp or high wattage bulb); two thermometers (-10°C to 110°C); five cans of the same size and material; spray paint in several colors (red, flat black, yellow, green, white); several corrugated cardboard squares (large enough to cover the tops of the cans); a clock with a second hand or a stop watch; water at room temperature; water at 50°C or greater.
Teacher Background Information:
Heat travels through a vacuum by radiation in the form of electromagnetic waves. What is more, light, also traveling in the form of electromagnetic energy, can be absorbed by certain colored materials and changed into heat energy by causing the molecules of the materials to vibrate more rapidly.
Generally, light colored materials (white or shiny) reflect most wave lengths of light and black absorbs most all wave lengths. Therefore, the molecules in a black material receive more energy than shiny material and speed up causing a heat build up.
Many experiments in school texts have students add hot water to containers of different materials to see which are the most efficient insulators. Students are sometimes surprised to find that metal containers get hot very quickly but loose their heat rapidly, also. See, through the following experiment, if the students can discover a possible reason for this. (Metal, while absorbing heat rapidly by conduction, is an efficient radiator also).
A major concern of space travelers is the build up of heat in the space craft. Currently, the Shuttle uses the cargo bay doors as giant radiators to prevent a dangerous build-up of heat. The doors are opened while in orbit to expose shiny silvered coverings which reflect the radiant heat reaching the Shuttle from the Sun in the form of electromagnetic waves. Try to relate the results of this experiment to the application of the concepts to the real situations encountered by space scientists.
Procedure:
- Prepare cans in several colors with the spray paint and allow to dry thoroughly.
- Fill two cans with equal amounts of water at room temperature.
- Place a piece of cardboard, through which you have made a small hole for a thermometer, on top of each can.
- Insert a thermometer into each cardboard making sure the bulb of each thermometer does not touch the sides or the bottom of the cans but extends into the water.
- Place the cans on opposite sides of the heat source about 20cm away.
- Record the temperature of the water in each can every two minutes for twenty to thirty minutes.
- Now fill each can with the same amount of hot water and record the temperature every two minutes for twenty to thirty minutes.
- Graph the results.
Which of the cans absorbed more heat by radiation? Which of the cans radiated the most heat energy? Why do you think this is so? What colors do you think would be the best for a spacecraft? Why do you think so? If you were to produce a solar collector to produce hot water, what color would be the most efficient for your device?
Extensions:
Try the experiments using containers made of other materials than metal. Repeat the experiment using empty cans. Explain what may have caused any differences in the results. Do the experiments again placing the cans further away from the heat source. Try using the sun as the heat source.
48. WHERE ON THE WORLD ARE WE
SUBJECT:
Science
GRADE:
7,8,9
GROUP SIZE:
Large
TIME:
50 minutes
TYPE OF ACTIVITY:
Construction Skill Development
TEACHING STRATEGY:
Expository Guided Discovery
CONCEPTS:
Latitude Pointer Stars Inclination
SKILLS:
Construction Following Directions Recording Data
Objectives: To learn a method of determining the latitude of your location on the Earth; to learn a method of locating the North Star.
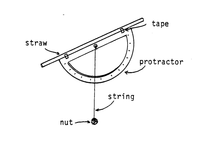
Materials: For each student or group of students: 1 drinking straw; protractor; piece of thread; washer or other weight; cellophane tape; magnetic compass.
Procedure:
- Tape the straw to the base of the protractor as shown in the drawing.
- Attach the thread to the center of the base of the protractor and attach the washer to the other end.
- Teach the students the following technique to locate the North Star. First, locate the Big Dipper (use a compass to locate the general direction of north if needed). Next, follow an imaginary line from the two stars which form the front of the Dipper (see illustration). The first star you come to in line with the "pointer" stars is the North Star.
- Point the straw/protractor sighting device at the North Star.
- Let the thread hang loose until it stops moving.
- Hold the thread tight against the protractor and read the degrees.
- Repeat the observation at least three times and record the readings. (Use the conversion table shown or subtract the readings on the protractor from 90 to arrive at the proper latitude angle.)
- Have the students take their devices home and take readings which they will bring back to class the next day.
- Average the readings from the class. This should be a close approximation of the actual latitude of your area.
Extension: Use the angle of latitude to construct a sundial. The angle is the same as the angle of the gnoman on a sundial for your area.
CONVERSION TABLE
| Reading from Protractor |
Degrees of Latitude |
|---|---|
| 105 | 15 |
| 110 | 20 |
| 115 | 25 |
| 120 | 30 |
| 125 | 35 |
| 130 | 40 |
| 135 | 45 |
| 140 | 50 |
| 145 | 55 |
| 150 | 60 |
| 155 | 65 |
| 160 | 70 |
| 165 | 75 |
Each degree of angle on the protractor is one degree of latitude.
49. LONGITUDE AND LATITUDE
SUBJECT:
Science
GRADE:
7,8,9
GROUP SIZE:
Large
TIME:
45 minutes
TYPE OF ACTIVITY:
Student Activity Skill Review
TEACHING STRATEGY:
Expository Guided Discovery
CONCEPTS:
Longitude Latitude Position
SKILLS:
Map Reading Reading and Reporting Data
Objectives: To review the concepts of latitude and longitude; to gain experience locating and reporting the position of sites on Earth in degrees of latitude and longitude.
Materials: Study sheet; pencils; map of the U.S. or a globe; straight edge.
Teacher Background Information:
It is essential that students be able to locate the latitude and longitude of an area on the Earth in order to use Landsat maps. The next lesson will introduce Landsat images and have students locate the position on Earth of the images supplied with the lesson.
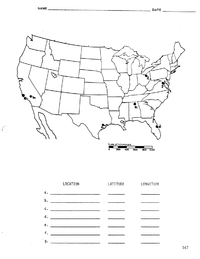
This lesson has the students locate the position of several facilities important to NASA and the Shuttle program. See if the students can determine the common denominator of the locations following their having determined the latitude and longitude of each.
Procedure:
- Reproduce the study sheet for each student.
- Using a map of the U.S., have the students locate the latitude and longitude of each position marked with a circle on the study sheet.
- Have the students record their positions on the sheet.
- What are some possible relationships between the locations circled on the map? Find out more about the facilities which can be found at the locations marked and their relationship to the space program.
Extensions: Have the students plot imaginary flights from one coordinate to another on a map. Review activity 57 in the “Come Fly With Me!"
K-6 manual.
50. MAPPING A PLANET'S MAGNETIC FIELD
SUBJECT:
Science
GRADE:
7,8,9
GROUP SIZE:
Large or Small
TIME:
60 minutes
TYPE OF ACTIVITY:
Teacher Demonstration or Student Activity
TEACHING STRATEGY:
Guided Discovery Expository
CONCEPTS:
Magnetic Field Planetary Model Magnetometer
SKILLS:
Experimentation Recording and Interpreting Data
Objectives: To model how an aircraft or space craft can map the magnetic field of a planet; to be able to produce a map of the magnetic field of a planetary model.
Materials: Two maps of an area, one covered with plastic; at least one magnetic compass; a styrofoam ball; a clear sheet of acetate; an overhead projector; pen or grease pencil; several small bar magnets; iron filings in a shaker bottle.
Teacher Background Information:
By flying through a planet's magnetic field, a craft can actually map a magnetic field's size, direction and strength using a magnetometer. Numerous NASA space launches, particularly in the Explorer series, have gathered such information. Specially equipped high-flying aircraft have also been used to map Earth's magnetic field and to develop the techniques used on the spacecraft.
Procedure:
Experiment A.
- Place a magnet under the plain map.
- Lay the acetate sheet on top of the map.
- Make several passes over the map with the "magnetometer" (compass).
- Make note of the direction of the compass needle. Use the laminated map to record the findings with a grease pencil.
- Check your findings by shaking metal filings on the plastic sheet covering the original map.
How did your findings, using the compass, compare with the pattern formed by the filings? Does this pattern appear similar to what you would expect to find on the Earth?
Experiment B.
- Place a magnet in the styrofoam ball.
- Set the ball on a cup so that it is supported away from the surface of a table.
- Use the compass to make several orbital passes around the “planet".
- Make a simple sketch of the magnetic field of the "unknown" planet.
- You can test your findings by using the plastic sheet and iron filings again.
Adapted from educational material s available from NASA Spacemobile program
51. WEIGHTLESS
SUBJECT:
Science
GRADE:
7,8,9
GROUP SIZE:
Small
TIME:
45 minutes
TYPE OF ACTIVITY:
Student Investigation
TEACHING STRATEGY:
Guided Discovery Demonstration
CONCEPTS:
Mass Weight Gravity
SKILLS:
Observation Inference Modeling
Objectives: To distinguish between weight and mass; to learn to compute specific gravity; to consider the effect on the weight of an object as it moves further away from the Earth.
Materials: Balance; spring scale; graduate; masses; string; object to weigh (make sure it will fit into the graduate).
Teacher Background Information:
Students sometimes have a difficult time distinguishing between mass and weight of objects. Simply put, mass is the amount of matter in an object. Weight is a measure of the force of gravity on an object. We use a scale to measure weight and a balance to measure mass. All objects in the universe have a gravitational attraction for one another. The larger the mass of the object, the more gravitational attraction it exerts. This is why Mars, with a diameter of 6794 km, has a gravitational pull of about 1/2 of Earth with a diameter of 12756 km. Jupiter on the other hand, has a diameter of 143,200 km and a gravity nearly 6 times that of Earth.
As the distance between two objects increases however, the gravitational pull decreases but the mass of the objects remains the same.
Teacher Demo:
Have the students hold two magnets close together and feel the pull. Move the magnets further apart and feel the pull again. Attach the magnets to two toy cars and place spring scales on the other end of each car. Measure the force exerted by the magnets at different distances from each other. This experiment is a model for gravitational pull, also. The popular notion is that when you get into orbit around the Earth that you are weightless, that is, out of the effect of Earth's gravity. Actually, you would have to get very far from the Earth not to be effected by its gravity. The Earth's atmosphere extends out some 32,000 km and is still held in place by gravity. Theoretically, you would always be under some effect of the gravity of Earth because every mass in the universe exerts an attraction for every other mass.
If you had a mass of 100 kilograms on the surface of the Earth, the Earth would exert a force of about 980 newtons on the mass, that is, it would weigh 980 newtons. You would be about 6440 km from the center of the Earth. The law of inverse squares states that, if you move to a distance twice that (12880 km) from the center of the earth, your weight would be 1/4, that is, (1/2)2 = 1/4. A distance three times the distance to the center would yield a gravity of 1/9 and so on. Notice these distances are measured from the center of the Earth not from the surface. Subtract the distance to the center from the total to get the distance from the surface.
What is important here is that an object moving away from the Earth loses weight but not mass. The object above, perhaps an astronaut, would still be the same astronaut floating in space. The astronaut would not be weightless (at 6440 km above the Earth, he or she would still weigh about 245 newtons) and would still have a mass of 100 kg.
Procedure
- Discuss with the students what we might mean by weightlessness in space. (By the way, the term micro-gravity is the proper term for the environment an object is in when in orbit)
- Do the Teacher Demo shown above with the students and discuss the information on computation of the weight of an object as it moves away from the Earth.
- Fill a 25 or 50 ml graduate half full with water. Mark the level.
- Attach a thread or string to a mineral sample or a lead sinker and suspend it from a spring scale. Record the weight.
- Lower the sample into the graduate and weigh again.
- Subtract the wet weight from the dry weight.
- Divide the difference into the dry weight. The result is the specific gravity.
The specific gravity is useful in the identification of rocks and minerals. This information will be useful in a future lesson.
Extensions:
Have the students consider the relationship between the buoyancy of an object in water and the equalization of forces of gravity by orbiting (centrifugal force) around a planet. Review Newton's laws and Kepler's laws and their application here. Have the students determine at what distance from the Earth the pull of gravity would be less than 1 newton.
52. DETECTING RADIATION
SUBJECT:
Science
GRADE:
7,8,9
GROUP SIZE:
Large
TIME:
60 minutes
TYPE OF ACTIVITY:
Teacher Demonstration
TEACHING STRATEGY:
Guided Discovery Discussion
CONCEPTS:
Radiation Detection Radiometer
SKILLS:
Observation Inference Interpreting Data
Objectives: To understand that radium can be detected; to understand that satellites use radium detecting devices.
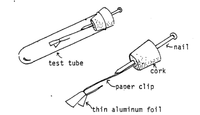
Materials: Test tube; small cork; small nail; paper clip; aluminum foil strips; alcohol; glue.
Teacher Background Information: Since radiation is so harmful to humans, unmanned NASA satellites are being used in space to detect the amount of radiation present. The following activity should help students to understand the necessity for detecting radiation and one type of instrument included on many radiation-studying satellites.
Procedure:
Before class, push the nail and paper clip through the cork together. Take aluminum gum wrapper and cut in half, lengthwise (1/2" x 3"). Soak strips in alcohol to dissolve glue and peel off paper backing.
Assemble as illustrated: nail, cork, paper clip - touching nail, test tube; aluminum foil - glued onto paper clip.
With the class assembled, demonstrate the presence of radioactivity by taking a comb and rubbing it on some wool and touching it to the nail sticking out of the test tube. Have students note what happens to the foil leaves.
- What causes the static electricity? (Rubbing the comb on wool generates static electricity, covering the comb with extra electrons.)
- When the comb is touch to the nail, what happens? (Electrons are transferred down the nail to the foil leaves)
- Why do the foil halves push away from each other and spread apart? (Because equal charges repel - in this case, negative and negative.)
You can cause the leaves to collapse again by removing the negative charge. This is demonstrated by rubbing a glass rod on a polyethylene plastic bag and touching the nail with the rod. The rod will have been charged positive by removal of electrons. Talk with the students about why the leaves went back together. Make sure they understand that the removal of electrons causes a positive charge and the leaves go back because fewer electrons are present.
Radiation can also cause electrons to be removed. To demonstrate the removal of electrons through radiation, set up the demonstration again but, after the leaves have separated, wait a period of time. The students will see that the halves will collapse on their own. This is a result, in part, of cosmic rays streaming through the jar, ionizing some of the air, discharging the foil. The collapse speed is a measure of the number of cosmic rays entering the jar.
Explain to the students that this type of instrument has been included on many of the radiation-studying satellites.
Through discussion and/or reading, find more complete answers to some of the following questions:
- What is radioactivity or when is an atom radioactive?
- What is a cosmic ray? How fast does it travel?
- What results would you expect if a solar storm were to erupt on the Sun? Can solar storms be predicted? Why would we want them to be?
- What is ionization?
53. DON'T LET THE STARS GET IN YOUR EYES
SUBJECT:
Science
GRADE:
7,8,9
GROUP SIZE:
Large or Small
TIME:
60 minutes
TYPE OF ACTIVITY:
Teacher/Student Demonstration
TEACHING STRATEGY:
Expository Guided Discovery
CONCEPTS:
Radiation Radioactivity Detection
SKILLS:
Reading for Information Observation/Inference
Objectives: To relate the flashes sometimes seen in your eyes to cosmic radiation; to review and strengthen the concept of radioactivity.
Materials: The radioactivity detector from the previous lesson; a Geiger counter (optional).
Teacher Background Information:
An unexpected effect of cosmic rays on humans was first noted on the Apollo 11 mission to the Moon in 1969. Astronaut "Buzz" Aldrin reported that he kept seeing flashes of light while his eyes were closed. On later flights, astronauts counted these flashes and Bill Pogue (on Skylab in 1973) saw eight flashes per minute. T. F. Budinger, the Principal Investigator for Experiment MA-106, collected descriptions of these flashes and did some experiments with high-energy ions shot out of a cyclotron in his laboratory. He knew exactly what kind of particles were in the cyclotron beam and what energy they had as they entered the heads of the volunteers. If Budinger aimed the beam through the brain, the volunteer did not see a flash. It was only when the high-energy ions passed through the eye that flashes were seen.
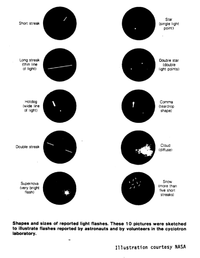
The many different shapes and sizes of flashes reported by the astronauts in space and by the volunteers at the cyclotron are shown in the study sheet. These different shapes and sizes complicate the explanation of how the flashes are produced. The simplest idea is that a cosmic ray causes a flash when it passes through the eye's "detector," the retina. The retina is a region at the back of the eyeball where nerve endings are sensitive to the light focused there by the lens at the front of the eye. The cosmic ray ionizes a few atoms or molecules, which produces a signal in the optic nerve. This signal is interpreted by the brain as a "single star" or perhaps a "comma." The "diffuse cloud" flashes seem to be something different. (See illustration)
The "long streak" might be caused by a cosmic ray that crosses along the surface of the retina. Double stars and double streaks are most probably caused by a cosmic ray that hits two parts of one eye or perhaps passes through both eyes (since no one can tell which eye sees any flash) The diffuse cloud could be caused by galactic cosmic rays with very high energy, high mass and high atomic number Z. Because they are moving so fast these "HZE particles" (for High-Z, High-Energy) might produce a flash of light like a shock wave as they enter the eyeball
Procedure:
The MA-106 Experiment on Apollo-Soyuz involved two astronauts. They were blindfolded 15 minutes before the experiment started so that their eyes would adapt to the darkness They would then record any flash and describe what they saw into a tape recorder. Cosmic ray detectors were mounted near the heads of the astronauts and the records of the responses of the astronauts were compared with the data from the detectors.
- Ask the students if they have ever experienced flashes of light in their eyes. Ask what they think these might be.
- Blindfold several volunteers and ask them to record any flashes they might see over a 30 minute period. Emphasize the importance of accuracy and not calling out flashes that don't really occur.
- Set up some of the detectors from the last lesson near the head of the volunteers to see if they react to the strike, if any, called out. If you have a Geiger counter set this up near the head and have a student record any strikes the instrument reports.
- Compare the data from the instruments with that reported by the students.
The students may not report any findings during this short experiment. If they try to stay aware of random strikes during the next few days they may be able to describe what they experienced and report back to class. The astronauts experienced many more strikes near the North and South poles. Why do you suppose that was?
Extensions:
Have the students read about the experiments carried out to gather information on these flashes. what other radiation effects have been explored in relationship to astronauts? Do pilots who fly commercial jets at high altitudes experience the same amounts of radiation exposure as astronauts? Why or why not? Have the students explore high energy particles and their nature.
54. "ROY G. BIV"
SUBJECT:
Science
GRADE:
7,8,9
GROUP SIZE:
Large
TIME:
2-45 minute periods
TYPE OF ACTIVITY:
Student Investigation ,
TEACHING STRATEGY:
Guided Discovery Expository
CONCEPTS:
Spectrum Spectography Elements
SKILLS:
Experimentation Recording and Interpreting Data
Objectives: To demonstrate that various elements can be distinguished by their light spectrum; to relate the experiment to the OAO satellite.
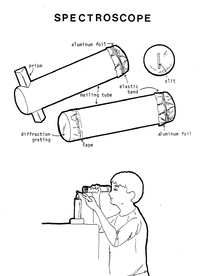
Materials: Mailing tube; aluminum foil; alcohol burner; diffraction grating or prism; scissors; pliers; straightened paper clips; elements such as: table salt - sodium chloride, boric acid - baron, copper sulfate = copper, limewater - calcium, lithium, barium and strontium.
Teacher Background Information:
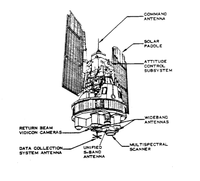
The Orbiting Astronomical Observatory OAO is an unmanned satellite designed to give astronomers their first sustained look into the universe from above the obscuring and distorting effects of the Earth's atmosphere. The OAO is the largest of the NASA scientific satellites under development and weighs nearly four thousand pounds” It is also the most electronically complex unmanned spacecraft ever developed by the U.S. It contains more than 440,000 separate parts and 30 miles of electrical wiring.
One thousand pounds of the weight is electronic astronomical observing instruments. It is a 10-foot long, eight-sided cylinder, seven feet wide. with the solar panels extended, the overall width of the spacecraft is 21 feet.
Future OAO spacecraft will have such a precise control system for pointing the scientific instruments that it could look at the width of a pencil 10 miles away. This precision is possible because of the six telescope star trackers mounted on the main body of the spacecraft.
The telescopes aboard the spacecraft will be used for several things. They will help map certain parts of the sky now hidden by direct clouds; clearer views of the planets will also be possible. They will make studies of stars to determine their chemical composition and learn more about the birth of stars. There will also be experiments which are concerned with the study of x-ray and gamma ray spectral regions. Finally, the telescopes will study stars and nebulae in the ultraviolet spectrum not visible from the Earth.
The following activity should help students to understand more about using the simple glass prism to show the spectrum and demonstrate how elements can be distinguished by their specific light spectrum.
Procedure:
- Ask the students to name the seven colors which make up the visible spectrum. “Roy G. Biv" is one way of helping students remember the colors: red, orange, yellow, green, blue, indigo and violet. Use a prism or diffraction grating or discuss a rainbow to demonstrate what white light is made up of. Talk about ultraviolet light being near the blue band of the visible light portion of the spectrum. Discuss the damage ultraviolet light can do. Why do we use sunglasses on very bright days? Why do we burn if we stay in the sun without protection for too long?
- If you have fluorescent minerals or fluorescent chalk, have the students observe the effect of ultraviolet light when you shine a light on them. Ask the students why, if the sun gives off so much ultraviolet light, we don't burn up. Tell them that the OA0 will study ultraviolet light that cannot penetrate our atmosphere by looking at it above the atmosphere and this information could lead to revisions of present theories of stellar origin and evolution;
- To help students understand the spectrum and how various elements can be distinguished by their light spectrum, have the students
a. take the prism or diffraction grating and place it in one end of the mailing tube;
b. attach aluminum foil on the other end with elastic
c. cut a slit in the aluminum foil;
d. light the alcohol lamp;
e. place a clean paper clip in the pliers, dip into element to be tested and place over flame;
f. hold prism end up to the eye and observe color spectrum of specific element;
g. discuss the visible spectrum that is observed and record in notebook the name and the colors observed;
h. change the paper clip for each element tested and repeat the test for all the elements you have.
55. INTERPRETING SATELLITE DATA
SUBJECT:
Science
GRADE:
7,8,9
GROUP SIZE:
Individual or Pairs
TIME:
60 minutes
TYPE OF ACTIVITY:
Student Investigation
TEACHING STRATEGY:
Expository Guided Discovery
CONCEPTS:
Landsat Earth Resource Management
SKILLS:
Interpreting Data Observation Following Direction
Objectives: To gain skill in the interpretation of satellite transmitted data about the earth; to consider the applications of data available from satellites to earth resource management; to consider the implications of earth data from satellites to the exploration of other planets.
Materials: Colored pencils (optional); study sheet; Landsat photos or one of the reference books suggested in the reference section of this lesson.
Teacher Background Information:
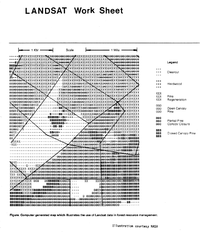
Landsat views the United States every 18 days sending back information in the form of "pixel" pictures which can be printed out in a format similar to the one on the study sheet or the computer can generate a photograph by interpreting the data and translating it into picture form. Each pixel segment, represented by the symbols: + , X , - , O , etc., covers an area 57 by 79 m ( 4503 m2 or about .45 hectares). An actual Landsat scan is 185 km wide so the study sheet is only a small portion of an entire Landsat scene. It has been shown that Landsat can yield timber management maps with about 90% accuracy compared to actual conditions on the Earth. The accuracy of the data from Landsat is checked by actually verifying the information with on-site inspections of the photographed area. This technique, called "ground truth", is very important in developing interpretation skills for information gained when exploring other planets. This lesson allows students to experience some of the skills needed to interpret a computer generated map transmitted by the Landsat satellite. Additional information and experiences can be found in an excellent NASA publication, Mission to Earth: Landsat Views of the World, NASA SP-360.
Procedure:
Have the students work in pairs or individually. Reproduce the map on the study sheet for each group of students. Have the students determine what kind of information can be obtained from this type of map.
Tree canopy refers to the development of branches; the more closed the canopy, the larger and more mature are the trees. Open canopy indicates that more ground shows through the branches of younger, smaller trees. Clearcut refers to areas where all standing trees have been removed. You may wish to have the students color in the areas on the map to designate each category listed above.
- What is the total area represented by the map? Total area of hardwood? Soft wood?
- Which area is beginning to grow young trees? has young trees? has older, mature trees?
- How does the area which has been clear cut compare to the selectively cut area? the most recently harvested?
- Describe the advantages and disadvantages of both selective and clear cutting.
- What do you suppose are the areas for which the computer provided no classification? what may have caused this?
- What might be the value of these maps for timber managers, lumber companies and paper companies?
- How might such maps aid an environmental protection agency? A space scientist exploring other planets?
Computer generated map which illustrates the use of Landsat data in forest resource management.
Illustration courtesy NASA
56. TILT!
SUBJECT:
Science
GRADE:
7,8,9
GROUP SIZE: Large
TIME:
45 minutes
TYPE OF ACTIVITY:
Teacher/Student Demonstration TEACHING STRATEGY Guided Discovery Discussion
CONCEPTS:
Earth Rotation Satellite Track Axis Tilt
SKILLS:
Observation Inference Interpreting Data
Objective: To demonstrate that satellites pass over different parts of the Earth on each revolution because the Earth is rotating beneath it.
Materials: Yardstick; large balloon (light in color and able to inflate to at least 15" in diameter or larger (circular in shape); two rubber bands; two felt markers (one black and one red); one large map of the world (wall map)
Procedure:
- Inflate the balloon. Tie it off with a rubber band.
- With a black felt marker, mark the North Pole (N) at the nozzle end and the South Pole (S) directly opposite
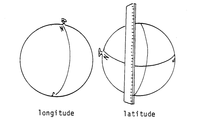
- Lay the yardstick on the table and line up "N" and "S" Poles. Have a student support the balloon while you draw a straight line of longitude from "N" to "S" Pole with the black felt marker.
- Turn the line of longitude perpendicular to the yardstick. Now support the balloon and ask a student to draw a line of latitude around the exact center of the balloon with a black felt marker. Ask the class which line of latitude this represents.
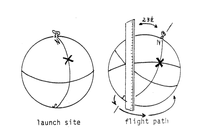
- Refer to the world map and locate 80° W longitude and 29° N latitude. Put a red X on that spot. Ask them where this is.
- Ask the class if anyone knows what the tilt of the earth‘s axis is. (23 1/2°)
- Approximate this tilt using the yardstick as a guide.
- Ask someone to hold the red felt marker on the red X while another student rotates the balloon to form a complete circle keeping the proper degree of inclination by using the yardstick below, and his or her line of sight.
Ask such questions as these:
- What does the balloon represent?
- What does the line of latitude represent?
- How many times does the orbital path cross the line of latitude?
- What would be the land mass crossed south of the line of latitude? Make a rough sketch of that land mass on the balloon.
- What other land masses would be crossed by the orbital path? Sketch those land masses, also.
- Where would be good locations for tracking stations?
You can have the students place dots to represent them on the balloon and have them record the location, the latitude and the longitude of several. Talk with the class about what things have to be considered before putting tracking stations in certain places.
57. WEATHER FRONTS MOVE
SUBJECT:
Science
GRADE:
7,8,9
GROUP SIZE:
Small
TIME:
60 minutes
TYPE OF ACTIVITY:
Student Investigation Discussion
TEACHING STRATEGY:
Guided Discovery Expository
CONCEPTS:
Weather Front Weather Map High/Low Pressure
SKILLS:
Reading for Information Interpreting Data
Objective: To measure the speed at which a front or a high moves.
Materials: Activity sheet; cm ruler.
Teacher Background Information:
One of the ways meteorologists can predict what the weather will look like for a particular area over the next few days, is to measure the speed at which the weather fronts are moving. This is helpful for pilots, for example, when they want to make sure that a front bringing poor weather is not going to move so fast that it interferes with getting from one place to another or in judging when a particular front will move out and provide good flying weather behind it. For these reasons, pilot training entails many hours of learning how weather works and the symbols used to communicate the weather picture.
Procedure:
- Hand out the activity sheets to each student.
- Talk with the class about the need for predicting weather and the notion that one of the criteria used for prediction is the speed at which fronts move.
- Discuss what each of the symbols means and clarify any concern about the directions on the activity sheet.
- When the students have finished, have them get together in small groups of 4-5 to compare the answers they came up with. Ask them to rethink any that now seem out of line.
Extension:
Bring in the weather maps from the local newspaper for two consecutive days. The symbols used may differ from the one shown in the activity sheet, but students can repeat the activity using the same method of measurement. Then, have them make their own prediction about the following day‘s weather for their area. Does the paper predict the same thing? See how close their predictions come to what actually happens.
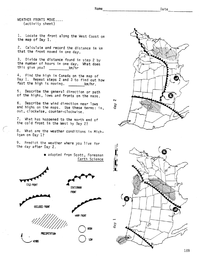
WEATHER FRONTS MOVE... (activity sheet)
- Locate the front along the West Coast on the map of Day 1.
- Calculate and record the distance in km that the front moved in one day.
- Divide the distance found in step 2 by the number of hours in one day. What does this give you? km/hr
- Find the high in Canada on the map of Day 1. Repeat steps 2 and 3 to find out how fast the high is moving. km/hr.
- Describe the general direction or path of the highs, lows and fronts on the maps.
- Describe the wind direction near lows and highs on the maps. Use these terms: in, out, clockwise, counter-clockwise.
- What has happened to the north end of the cold front in the West by Day 2?
- What are the weather conditions in Michigan on Day 1?
- Predict the weather where you live for the day after Day 2.
adapted from Scott, Foresman - Earth Science
58. READING AND PLOTTING WEATHER DATA
SUBJECT:
Science
GRADE:
7.8.9
GROUP SIZE:
Large
TIME:
60 minutes
TYPE OF ACTIVITY:
Student Activity Skill Practice TEACHING STRATEGY Expository Guided Discovery
CONCEPTS:
Weather Symbols Weather Maps Meteorology
SKILLS:
Reading and Interpreting Data Plotting Data
Objective: To practice reading and using the standard weather symbols used around the world.
Materials: Activity sheet and pencils.
Teacher Background Information:
Understanding and predicting the weather is a vital concern of aviation and space for poor weather can cause delays and cancellations of flights, at best, and loss of life, at worst. As a protection from misunderstanding, weather symbols have been standardized around the world and meteorologists receive and transmit weather information using these symbols.
The following activity deals with reading some of the more common symbols and using them to draw weather station map entries for three cities.
Procedure:
Hand out the activity sheets to each student. Then,
- Discuss some of the reasons why the aviation and space industry must obtain, and thoroughly understand, reliable weather data.
- Discuss the need for meteorologists to have standard international symbols to relay weather data.
- Have the class look over the Weather Symbol Table together. Look at the similarities and get a feeling for what the various symbols stand for.
- Clarify the directions on the activity sheet so students understand how to proceed with their drawings.
Unless they have had some prior experience with this, drawing the weather station entry may seem a bit complicated at first. The important part is to understand the symbols and to realize how important it is to be absolutely accurate in using them.
Extension:
Obtain a weather service map. Have the students choose a city and write a paragraph telling the weather picture is for that city on a specific day. You can request maps from the Weather Service Bureau at a major airport nearby or from a local TV station which the National Weather Bureau service.
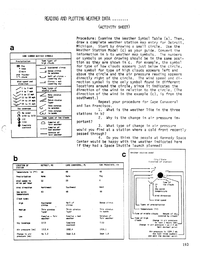
WEATHER DATA (ACTIVITY SHEET)
Procedure: Examine the weather Symbol Table (a). Then, draw a complete weather station map entry for Detroit, Michigan. Start by drawing a small circle. Use the Weather Station Model (C) as your guide. Convert the information in b to weather map symbols. The numbers or symbols on your drawing should be in the same position as they are shown in c. For example, the symbol for type of low clouds appears just below the circle, the symbol for type of high clouds appears left and above the circle and the air pressure reading appears directly right of the circle. The wind speed and direction symbol is the only symbol found in different locations around the circle, since it indicates the direction of the wind in relation to the circle (The direction of the wind in the example (c) is from the southwest.)
Repeat your procedure for Cape Canaveral and San Francisco
- What is the weather like in the three stations in b?
- Why is the change in air pressure important?
- What type of change in air pressure would you find at a station where a cold front recently passed through?
- Do you think the people at Kennedy Space Center would be happy with the weather indicated here if they had a Space Shuttle launched planned?
59. ASTRONOMICAL UNIT
SUBJECT:
Science
GRADE:
7,8,9
GROUP SIZE:
Small
TIME:
45 minutes
TYPE OF ACTIVITY:
Student Activity Modeling
TEACHING STRATEGY: Expository Guided Discovery
CONCEPTS:
Astronomical Unit Solar System Distance
SKILLS:
Modeling Measuring Plotting Data
Objectives: To gain experience with the concept of Astronomical Unit (A.U.); to construct a scale model of the solar system using A.U.'s.
Materials: 1 meter stick per group; tape measure 40 meters long (optional); 1 adding machine tape per group; pencil.
Teacher Background Information:
In the study of astronomy, astronomers use a convenient unit of measurement known as an Astronomical Unit or A.U. The A.U. is a short cut in describing distances in the solar system. The distance between the Sun and the Earth is, on the average, 149,600,000 kilometers (93 million miles.)
Astronomers call this distance between the Earth and the Sun 1 A.U. An object twice the distance away would be called 2 A.U.'s away and so on. The A.U. is really a scale showing distance. The scale is 1 A.U. = 149,600,000 kilometers.
Procedure:
- Divide the students into groups of 4 or 5.
- In a hallway, a gym or outdoors have each group extend their 40 meter adding machine tape.
- Identify one end of the tape as the Sun.
- Measure one meter from the Sun end and label that point as the Earth.
- Use the diagram below to mark the positions of the rest of the planets and the asteroid belt as fractions or multiples of 1 A.U.
| PLANET | A.U.'s |
|---|---|
| MERCURY | .387 |
| VENUS | .723 |
| EARTH | 1.000 |
| MARS | 1.524 |
| asteroids | 2.800 |
| JUPITER | 5.203 |
| SATURN | 9.523 |
| URANUS | 19.164 |
| NEPTUNE | 29.987 |
| PLUTO | 39.370 |
Extensions
Once the students have the relative distances on their tapes, try to find a place in the school where the scale can be permanently displayed. Arrange to paint the planets names and/or images in proportional sizes at the given distances.
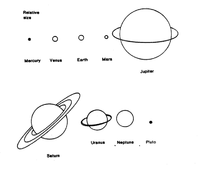
NOTE: It is nearly impossible to get the size of the planets and the distances proportional to one another at the same time in a school building. The relative sizes in the illustration below, while proportional to one another would require that Pluto be nearly a mile from the Sun. Activity # 45 in the K-6 'Come Fly with Me' manual gives an easy to use scale of sizes.
If a larger scale is desired, why not have the students compute the distances and make arrangements in your town to place a picture or a notation about the scale and the project at a building at the appropriate distance from your "Sun" at the school.
60. PARALLAX ONE
SUBJECT:
Science
GRADE:
7.8.9
GROUP SIZE:
Small or Large
TIME:
45 minutes
TYPE OF ACTIVITY:
Teacher Demo or Student Investigation
TEACHING STRATEGY:
Expository Guided Discovery
CONCEPTS:
Parallax Measuring Long Distances
SKILLS:
Observation Measuring Plotting Data
Objective: To provide students with an understanding that near objects appear to change their positions more than distant objects when the position of the observer changes.
Materials: Two paper cups; meter stick; table or desk; chalkboard or wall; chalk.
Teacher Background Information:
As we drive down the highway and look at a tree in the field, the tree seems to change position against the woodland in the distant background. If the tree is close to the road, this apparent shift is great; if the tree is close to the woods, its apparent shift is small.
Such a shift in apparent position is called parallax and is useful in determining the relative distance to far off objects such as stars. Astronomers observe a star's location with respect to more distant stars. They will sight the more distant star with a closer star and then wait a few months while the earth moves in its orbit around the Sun. Then, they observe the star's position again. Nearby stars appear to shift to a slightly different position with respect to the more distant one.
This shift is called parallax and it can be measured. The nearer star will appear to shift farther than more distant stars and the very distant stars may have shifts too small to measure. This activity gives students the opportunity to see how parallax works. The activity which follows, Parallax Two, provides students with the opportunity to do some calculations regarding parallax.
Procedure:
Adapted from NASA educational materials
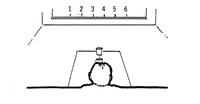
Have the students put two paper cups about 30cm apart on the desk or table, as shown in the illustration.
Make 6 chalk marks 50 cm apart on the wall or chalk board on the other side of the classroom and number them 1 through 6 as shown in the illustration.
- Have a student place himself or herself lm behind the table like the student in the illustration. Make sure the eyes are level with the paper cups.
- Ask the student to draw a picture of the paper cups as they appear from that vantage point. Include the positions of the chalk marks. Then,
- Have the student move lm to the left and draw the paper cups as they appear now. Show their position in relation to the chalk marks on the wall. Have the student move to two other positions and draw what is seen.
- Ask the students to think about these questions:
- What do the two cups represent?
- When the student shifts position what does that shift represent?
- How are the drawings different from each other?
- Which paper cup appeared to move the most?
- What effect does the observer's position have on the apparent position of the things seen?
61. PARALLAX TWO
SUBJECT:
Science
GRADE:
7,8,9
GROUP SIZE:
Large or Small
TIME:
45 minutes
TYPE OF ACTIVITY:
Student Investigation TEACHING STRATEGY Expository Guided Discovery
CONCEPTS:
Parallax Relative Distance Relative Motion
SKILLS: Measuring Graphing Plotting Data
Objective: To learn how parallax can be used to determine the relative distance to the stars; to calculate, using parallax, the distance to an object in the classroom.
Materials: Meter stick; 2 styrofoam balls; chalkboard; block with mounted protractor; ruler; graph paper.
Teacher Background Information: Before class begins, draw and number about 10 vertical lines on the chalkboard with 30cm between them.
Procedure:
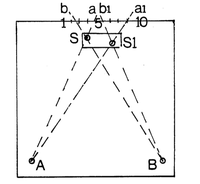
Have the students prepare a piece of graph paper by drawing their classroom to scale. You can discuss with your students the appropriate scale to use given the size of the classroom. Ask the students to use a whole sheet of paper and to indicate the positions of the numbered chalkboard lines on the drawing
Now,
- Have students move to the back left hand corner of the room (indicate this as point A on their drawing) and sight along the edge of a ruler at "star" S. Have them note the number of the line that appears to be in line with "star" S and indicate this position on their paper as "a". Have them draw a dotted line from A to "a".
- Without moving, have the students sight at star S1. The students should note the number of the line that appears to be in line with star S1 as a1 and draw a dotted line from A to a1.
- Have student move to the right hand back corner of the room and mark this point on his/her paper and sight along the ruler at star S and then star S1 indicating the apparent positions of the chalk lines on the board as b and b1. Draw lines from B to b and from B to b1.
- Have students draw a small circle where line Aa crosses Bb and indicate this circle as S, Have them draw another circle when line Aa1 crosses Bb1 and indicate this S1.
- Have students measure the distance from the back of the room, to the positions of S and S1 on their paper and calculate these distances using the same scale you came up with earlier. Now, have them measure the actual distance from the back of the room to S and to S1 with a meter stick.
- Discuss the following with your students as a way to apply this activity to using parallax to measure distances to stars:
On July 1, consider the earth's position as A. We sight on two nearby stars S and S1 against their background of stars. On January 1 we consider the earth's position as B and we sight on the same two stars against their backgrounds. What is the distance between points A and B? We notice that the apparent shift behind star S is very slight, but the apparent shift behind star S1 is twice as great. Which star is closest to the earth?
Adapted from NASA educational materials
62. RADIO TELESCOPES
SUBJECT:
Science
GRADE:
7,8,9
GROUP SIZE:
Small or Large
TIME:
45 Minutes
TYPE OF ACTIVITY:
Teacher Demonstration or Student Activity
TEACHING STRATEGY:
Guided Discovery
CONCEPTS:
Parabolic Reflector Radio waves Directionality of Radio waves
SKILLS:
Observation Modeling Interpreting Data
Objectives: To see how a radio telescope works; to understand some of the reasons for using radio telescopes.
Materials: Radio; umbrella; heavy-duty aluminum foil (to line the inside of the umbrella).
Teacher Background Information:
"Our galaxy, the Milky Way, contains between 100 billion and 300 billion stars. One star out of every 18,000 has the potential for supporting a planet similar to Earth. Yet, even if we start with the lowest possible galactic number of 100 billion stars, this means that just within the Milky Way, some five million stars could meet the basic requirements for life. Beyond our own corner of the universe, the hundreds of billions of other galaxies might harbor millions of other suns supporting millions of other Earth-like planets, as well.
Most crucial to the question of extraterrestrial visitations is the problem of interstellar travel. The distance to even the nearest star is so great as to render space travel, by any means we now know, impossible within a human lifetime. A more likely form of contact with extraterrestrial intelligence (if it exists) may be through long-distance messages rather than actual visitations; radiowave transmissions now seem the most likely method of interstellar communication."
- Taken from, “Life in the Universe: an Introduction to the Search for Extra-terrestrial Intelligence," a brochure from Harvard-Smithsonian Center for Astrophysics.
Procedure:
First, place the radio on the desk or a table in the classroom. Starting at one end, find weak stations on the radio and write down the dial numbers of five of them. Next, make a model radio telescope by opening the umbrella and lining the inside with sheets of aluminum foil. Now,
- Ask a student to rotate the radio until the best reception possible comes from one of the weak stations.
- Have the student hold the umbrella behind the radio with the aluminum foil facing the incoming waves as shown.
- Slowly move the umbrella closer to or farther from the radio until the position that best improves the strength of the radio waves is found.
With the class, repeat steps 1, 2 and 3 above for the other weak stations and put a check mark next to each station whose radio waves are strengthened by the radio telescope. Finally, place the radio telescope model between the radio and the incoming waves as shown
Notice what happens to the radio waves with the "telescope" in this position.
Discuss with the class such questions as:
- Where did the radio waves that the radio received come from? (the station)
- Where do radio waves that are picked up by actual radio telescopes come from? (Sun, other stars, quasars, pulsars)
- What happened when the umbrella was put between the radio and the transmitting station? (Blocked the waves)
- What is the function of the aluminum foil in this activity? (Acts as reflector for the waves.)
- Why did the radio waves strengthen when they were reflected by the umbrella? (Concentrated all the waves captured by the parabolic arc and reflected them to one point.
- Why do we listen to the sounds from space? (To "see" what stars are doing, to get beyond what visible light telescopes can see, to find new stars; to listen for the sounds of extraterrestrial life in space.)
- If there are any extraterrestrials out there, what message might they be trying to get through to us?
Extension:
- Discuss the possibility of extraterrestrial life with the students and, just for fun, assume that the principles of bio-chemistry remain constant in the universe. What sorts of creatures might have evolved out there on other planets? Think about the environment of the planet and design a life form that "fits" the environment of choice. (Mars, for example, might have a very large, red, toad-like creature with enormous webbed feet for use as sand shoes, with very strong hind legs for magnificent leaps in the reduced gravity and huge deploy-able wings that he uses, along with those webbed feet, for sand surfing when the spirit moves him. He probably lives for frozen CO2!) Have students choose a planet or star that we know something about and draw a form of life they think would be appropriate for it.
- Find information on the radio transmitter ET made in the movie. How is this similar to the radio telescope model made by the students?
63. A TRIP TO THE PLANETS
SUBJECT:
Science
GRADE:
7,8,9
GROUP SIZE:
Small
TIME:
Several periods
TYPE OF ACTIVITY:
Student Investigation
TEACHING STRATEGY:
Open Discovery Guided Discovery
CONCEPTS:
Solar System Planet Environment
SKILLS:
Reading for Information Presenting Data
Objectives: To provide students with an understanding of some of the similarities and differences between the planets; to provide an understanding of the environmental conditions of the planets.
Materials: Books, pamphlets, etc., on the various planets; discussion sheet.
Teacher Background Information:
The ancient astronomers observed points of light in the sky which appeared to wander among the stars. They called these objects planets, which means "wanderers," and named them after great mythological deities - Jupiter, king of the Roman gods; Mars, the Roman god of war; Mercury, messenger of the gods; Venus, the Roman god of love and beauty; and Saturn, father of Jupiter and god of agriculture.
In the past 25 years of the Space Age, knowledge about the solar system has advanced farther than in all the previous centuries since civilization began. Revolutionary views of the planets have been provided, mostly by NASA spacecraft but also by NASA-supported telescopic, balloon, sounding rockets and high altitude aircraft studies.
Mercury has been seen by Mariner 10 spacecraft and sharp pictures of about half of the planet's surface have been provided. The Pioneer Venus mission dropped five probes into the Venusian atmosphere and put an orbiter around the planet. Earth has been viewed from space in a number of ways including weather satellites, Landsat and, of course, by our astronauts standing on the Moon. Viking spacecraft have brought information of Mars and raised as many questions as they have answered.
These are exciting times for astronomers and your students can begin a look at this solar system of ours at a time when news is abundant and ever changing.
Procedure:
- Write the word PLANET on the chalkboard and ask what the word means. Arrive at a workable and accurate definition and write it on the board.
- Ask what the planets of our solar system are called. Write them on the board.
- Ask what solar system means. Clarify its meaning with students and write it on the board.
- Have the students put the planets in relative order from the Sun. As the class discusses the planets in the solar system, work through the definitions of at least these words before they proceed: planet, star, solar system, galaxy and universe. Write any questions that come up during the discussion on the chalkboard and let students know they will be finding information on some of these questions.
- Divide the class into groups and assign them a specific planet. They are to search for information on the environmental conditions of their planets.
They should look for such things as:
- the atmosphere of the planet
- any rocks or minerals the planet contains
- any forms of life
- the range of temperatures
- how the planet might have originated
- when astronomers first found it
- its distance from the Sun and from the Earth
- how the planet compares to other planets, especially to the Earth
- any moons or rings it may have
- what spacecraft or techniques were used to gather data about the planet
Once the data is gathered, each group is responsible for providing a detailed booklet complete with pictures or diagrams for the other groups to read. This is a big responsibility so information must be accurate and up-to-date. Make sure your students know that this writing is to be read and will be accepted as factually and honestly presented.
After the class has had the opportunity to read all the booklets, hold a general class discussion and discuss some of the questions on the activity sheet found on the following page.
Extension:
Have students write a travelogue script from the point of view of the planets; that is, in the first-person, i.e., “I am Mercury. I ... etc.) Select photos of the various planets from the NASA web site, find music appropriate for a planetary travelogue and put together a presentation for other classes to see and hear.
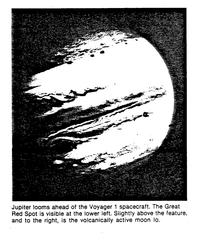
Jupiter looms ahead of the Voyager 1 spacecraft. The Great Pied Spot is visible at the lower left. Slightly above the feature, and to the right, is the volcanically active moon Io.
A TRIP TO THE PLANETS
Questions for Discussion
- What are some of the similarities between the inner planets?
- What are some of the differences?
- Why do ground telescope observers have difficulty in studying Mercury?
- Why is life on Mercury impossible?
- Describe Venus' cloud cover and atmosphere.
- Describe the planetary theory regarding a planet's loss of the original gases in its atmosphere.
- Which of the four inner planets apparently has no magnetic field?
- What do you think would happen to Earth if all of the carbon dioxide locked up in its rocks suddenly escaped into its atmosphere? What could cause this cataclysm?
- There are three hypotheses on how the inner planets acquired potentially volatile materials: primary atmosphere, grain accretion, and external source. Describe them and explain why you think a particular one is most likely.
- Why are conditions on Earth favorable to life?
- Why has Earth's atmosphere caused the premature fall of the Skylab space station?
- Give and explain your theory of the Moon‘s origin?
- Discuss why you think or don't believe that there is or was life on Mars?
- Why do geologists enjoy studying Mars?
- Why does the Mars moon Phobos interest scientists?
- How does the nature of the solar system change beyond Mars?
- How many satellites has Saturn?
- What are the most popular hypotheses concerning the origin of Saturn's rings?
- How does Saturn resemble Jupiter? Uranus? Neptune?
- What is the solar system's largest satellite? It's smallest? It's most (environmentally) like the Earth? It's most likely to have resources the Earth can recover and use?
64. LUNAR CRATER DEMONSTRATION
SUBJECT:
Science
GRADE:
7,8,9
GROUP SIZE:
Small
TIME:
60 minutes
TYPE OF ACTIVITY:
Student Investigation
TEACHING STRATEGY:
Expository Guided Discovery
CONCEPTS:
Cratering Interpreting Data Modeling
SKILLS:
Modeling Experimenting Interpreting Data
Objectives: To simulate the cratering process found on the Moon and planets; to investigate the effects of the angle of the Sun on the viability of craters in photographs; to demonstrate the aging process of craters on the Moon.
Materials: Five petri dishes; fine mesh sand; simulated raindrop maker (fine mesh nylon stocking stretched on an embroidery hoop.); water sprayer (spray bottle type); container for damp sand; old newspapers for table top; camera and film; stop watch.
Teacher Background Information: This experiment is designed to create craters in dry sand by placing filled petri dishes in a light rain or by using simulated raindrops over the dishes. The raindrop craters represent a relatively random process in which each drop has about the same chance of impacting in a given area as in any other area. Given enough time, several impacts may occur by chance in the same spot causing a large crater which may be mistaken for a crater formed by a single event.
Careful observation of large craters may reveal that they were in fact formed by several "hits" in the same area.
As more and more craters are formed, they begin to overlap and destroy one another. The craters will start out small and theoretically "saturate" an area with craters of about the same size. Slowly, as meteorites hit the same areas more than once, the crater size in an area will grow. Generally, the larger the craters in an area the older the area is thought to be.
Procedure:
- Fill the petri dishes with dry sand and smooth the tops off.
- Place a dish in a light rain for about 5 seconds. This should produce only a few craters. How do the craters compare in size? Are they clustered or single? Do they overlap?
- Place a second dish in the rain for about 30 seconds. How do these dishes compare?
- Drop a marble or steel bearing into another dish or make a crater with your finger. Place this dish in the rain for about 30 seconds. What happened to the large crater you made?
- Form craters in two more dishes with the bearings or your finger. Place one dish in the rain for two minutes and the other for about four minutes. What happened to the large craters? Are there any tiny craters in the dishes? These can be formed by the "ejecta" from the other craters. Are there more of the tiny craters in the dish left for 30 seconds? in the dish for 5 seconds?
Extensions:
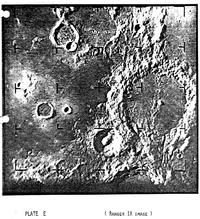
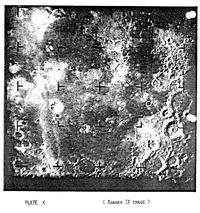
Turn off all the lights in the room and shine a light on the dishes from different angles. Compare the number of craters you see with the light at several angles. Try photographing the dishes in each of the lighting situations. The identification of craters and other features on the Moon depends greatly on the angle of illumination. This is easily seen by looking at the moon at different stages through a telescope. The tiny details are best seen at the sunset line where the shadows are the greatest. This does exaggerate the features however and may lead to false conclusions about the relative height of the ridges. Compare the photos of your dishes with the real thing.
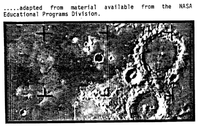
adapted from material available from the NASA Educational Programs Division.
65. HOW LONG 'TIL WE GET THERE?
SUBJECT:
Science
GRADE:
7,8,9
GROUP SIZE:
Individual
TIME:
60 minutes
TYPE OF ACTIVITY:
Student Activity Discussion ~
TEACHING STRATEGY Guided Discovery Discussion
CONCEPTS:
Light Year Relative Distance Space Travel
SKILLS:
Reading and Interpreting Data Computation
Objectives: To provide the opportunity to calculate distances from Earth to a "nearby" star; to understand one of the difficulties about traveling in space is the time it takes to get somewhere.
Materials: Activity sheet provided.
Teacher Background Information:
One of the major problems with space travel is the amount of time it takes to cover the vast distances to even our closest neighbors. This short exercise gives the students some feeling about those distances and the time to cover them. Though this is primarily a math activity, the concept is essential to the understanding of many of the other problems associated with space travel.
Procedure:
Before handing out the activity sheet, talk with the students about some of the more fanciful space programs on TV or at the movies. Travel between planets and stars on some of these programs seems rather easy but, once the vast distances are truly comprehended, the difficulty of getting from one planet to another, using present technology, becomes apparent. Ask the students if they know how far it is to the nearest stars or to the recently discovered solar systems. Get some mileage estimates and write them on the board. Then put up the following chart:
| STAR NAME | DISTANCE IN LIGHT YEARS |
|---|---|
| Proxima Centauri | 4.3 |
| Barnard's Star | 6.0 |
| Wolf 359 | 8.1 |
| Lal 21185 | 8.2 |
| Sirius | 8.7 |
| UV Cet | 9.0 |
| Ross 154 | 9.3 |
| Ross 248 | 10.3 |
| Eri | 10.8 |
| Ross 128 | 11.1 |
| 61 Cyg | 11.2 |
| Procyon | 11.3 |
Ask your students to select a star for use in the activity and hand out the activity sheets to each of them. Talk about light years with them and make sure each has computed the first question correctly. Do a second question with them using a star they picked. Check again to be sure they understand how to compute correctly. Let them finish the rest of the problems on their own.
Extensions:
Have your students look up the distance to other stars they may have heard of or to the Vega system where a solar system was recently discovered. Have them compute the distance and perhaps the length of time it would take to travel there at some portion of the speed of light. If it were possible to travel at the speed of light, how long would it take? (See lesson 92 on page 229, "It's All Relative," of the K-6 "Come Fly with Me" science book for more ideas)
ACTIVITY SHEET
FOR HOW LONG 'TIL WE GET THERE?
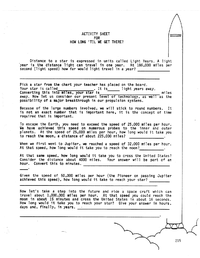
Distance to a star is expressed in units called Light Years. A light year is the distance light can travel in one year. At 186,000 miles per second (light speed) how far would light travel in a year?
Pick a star from the chart your teacher has placed on the board.
Your star is called _________. It is _________light years away.
Converting this into miles, your star is __________miles away. Now let us consider our present level of technology, as well as the possibility of a major breakthrough in our propulsion systems.
Because of the large numbers involved, we will stick to round numbers. It is not an exact number that is important here, it is the concept of time required that is important.
To escape the Earth, you need to exceed the speed of 25,000 miles per hour. We have achieved this speed on numerous probes to the inner and outer planets. At the speed of 25,000 miles per hour, how long would it take you to reach the moon, a distance of about 225,000 miles? _______________.
When we first went to Jupiter, we reached a speed of 32,000 miles per hour. At that speed, how long would it take you to reach the moon? __________.
At that same speed, how long would it take you to cross the United States? Consider the distance about 4000 miles. Your answer will be part of an hour. Convert this to minutes. _________________
Given the speed of 50,000 miles per hour (the Pioneer on passing Jupiter achieved this speed), how long would it take to reach your star? ______________
Now let's take a step into the future and ride a space craft which can travel about 1,000,000 miles per hour. At that speed you could reach the moon in about 15 minutes and cross the United States in about 16 seconds. How long would it take you to reach your star? Give your answer in hours, days and, finally, in years. _________________
66. COMETS
SUBJECT:
Science
GRADE:
7,8,9
GROUP SIZE:
Large
TIME:
60 minutes
TYPE OF ACTIVITY:
Discussion Student Investigation
TEACHING STRATEGY:
Open Discovery Guided Discovery
CONCEPTS:
Comet Orbit Period
SKILLS:
Reading for Information Interpreting Data
Objectives: To understand the structure of a comet; to understand comet orbits and periods.
Materials: Books, pamphlets, etc., on comets.
Teacher Background Information:
In 582 AD, Gregory of Tours wrote the following:
- ". . . there were rains, lightnings and great thunderclaps in the month of January. Trees blossomed; the comet appeared in such a way that round about it there was a great blackness; it shone through the dark as if set in a cavity, glittering and spreading abroad its hair . . . And on the holy day of Easter, in the city of Soissons, men saw the heavens aflame, in such wise that there appeared two fires, the one greater, the other less. But after the space of two hours they were joined together, making a great beacon-light before they vanished away. In the territory of Paris there rained real blood from the clouds, falling upon the garments of many men, who were stained and spotted that they stripped themselves of their own clothing in horror."
By the late 1600's, due in large measure to astronomers like Tycho Brahe and Sir Edmund Halley, accounts of such destruction following in the wake of a comet sighting had become a great deal rarer. However, enthusiasm for comets has not waned (witness the recent movie "Comet" which brought celluloid disaster to the greater part of Arizona). The return of Halley‘s Comet in 1985 and 1986, provides an even greater interest in what comets are all about.
Because of the return visit, several European countries, the Soviet Union and Japan designed spacecraft to study Halley's comet and, though the U.S. plan to design a craft specifically to study Halley was rejected, a satellite already in orbit was deflected to get some closer pictures of the comet as it passes by.
Procedure:
- Write the word COMET on the board and read the account written in 582 AD by Gregory of Tours. Discuss the passage and ask the students to relate what information they have on comets.
- As the students bring up information that is unclear or contradictory, work with them to formulate questions for them to find information on.
Some of the likely questions might be:
- Just what are comets?
- What are they made of?
- Where do they come from?
- How come some show up in regular periods of time?
- Why are they called comets?
- What comet(s) might we be able to see during the next few years?
- How are comets named?
- Why do they have a tail?
- What happens when one hits the Earth?
- What are the chances of that happening?
- Should we be worried about that, too?!?
Once the students have generated questions, ask how they think they might find information that would help them to answer some of the questions. Talk about the possibilities - where to look, what to read, who to write or talk to. Divide the questions among the students and ask them to do some searching and to report back to the class in a way that is as exciting as watching a comet streak across the sky.
Data from "Comets,"
Center for Astrophysics, Harvard Col. Observatory, Cambridge, MA 218
67. WHAT THE ROCKS TELL US
SUBJECT:
Science
GRADE:
7,8,9
GROUP SIZE:
Small
TIME:
2-45 minute periods
TYPE OF ACTIVITY:
Student Investigation Teacher Demo
TEACHING STRATEGY:
Expository Guided Discovery
CONCEPTS:
Rock Identification Moon Rocks
SKILLS:
Following Directions Collecting and Interpreting Data
Objectives: To have students use various methods to identify rocks; to relate the study of Earth rocks to Moon rocks.
Materials: Unknown rocks, numbered; dilute hydro-choloric acid; knife blade or nail; hand lens; colored pens or crayons, activity sheet; rock identification key; Moon Rocks (See end of activity for information).
Teacher Background Information:
Rocks, of course, cannot literally speak. But they do contain interesting stories and they can reveal their stories through the scientist's experienced eyes and sophisticated instruments. The shape, size, arrangement and composition of the individual grains and crystals in a rock tell about the history of the rock. The rock's internal "radioactive clock" tells us its age. Tiny tracks may even tell the radiation history of the Sun during the last 100,000 years.
In some aspects, the appearance of lunar rocks resembles that of Earth rocks. The minerals are the same. The grain sizes are comparable. The shapes are familiar. But in other aspects, their appearance differs significantly. For example, the Moon rock's surface is pitted with tiny craters, and the rocks are extraordinarily fresh. In order to compare Moon rocks with Earth rocks, students will need some background in identifying various rocks. The activity sheet should help them to do that.
Procedure:
Provide activity sheets for each student or small group of 2 - 3. Provide a copy of a rock identification key to each student or group or have a couple at hand in a learning center where the activity can be completed.
Explain that the activity sheet is in three parts:
- Part A can be completed by using the various identification methods the students should be familiar with (Acid, Streak, Hardness, Specific Gravity Tests).
- Part B can be completed using their own observations and/or other sources such as their textbook or books on rocks.
- Part C will require that they do some research, use their observations and experiences and think very carefully about what they have read and observed.
Finally, provide the students with the set of Moon Rocks obtained from NASA and complete some of the activities provided.
To obtain Moon Rocks requires that a teacher be certified by NASA at a workshop where trained personnel provide insight into how to use the Moon Rocks most effectively in the classroom. Security information is also provided at that time. Contact the NASA Teacher Resource Center for your area.
ACTIVITY SHEET
PART A
- Divide a sheet of paper into five columns
- At the head of the first column write UNKNOWN SAMPLE. Title the remaining columns as follows: ROCK NAME, ROCK FAMILY, DRAWING, OBSERVATIONS.
- Write the number of each of the rock samples down the left side of the page, as shown.
- Use the key your teacher provides to identify the unknown rocks. Indicate whether the sample belongs to the igneous, sedimentary or metamorphic family. Allow enough space to draw and color each rock in the fourth column.
- Record anything unusual you observe in the OBSERVATIONS column.
PART B
Sometimes it is very difficult to tell whether a rock is igneous, sedimentary or metamorphic. Make a table, such as the one shown, and list as many of the outstanding features you can think of for each family of rocks. You may use your own observations or check with other sources such as books on rocks or a science textbook that covers this area.
PART C
Answer the following questions:
- What might be one reason two samples of the same rock type sometimes look different?
- Why do you suppose most of the rocks we see at the surface of the Earth are in the sedimentary family?
- What may have caused the bands of color to form in gneiss? In what kind of rock are layers usually found? How is gneiss different from that kind of rock?
ROCK IDENTIFICATION KEY
| Name of rock | Description |
|---|---|
| 1. Basalt | dark gray to black; crystals not usually visible; heavier than #10 |
| 2. Bituminous | soft, shiny coal; cannot be scratched by fingernail |
| 3. Conglomerate | cemented pebbles |
| 4. Gabbro | large, dark, interlocking crystals |
| 5. Gneiss | bands of color that may or may not be bent; often visible crystals |
| 6. Granite | interlocking pink, gray, and dark crystals |
| 7. Limestone | may contain tiny shells or interlocking crystals; usually light-colored; fizzes in acid |
| 8. Marble | color varies, may appear very crystalline; fizzes in acid |
| 9. Obsidian | dark; glassy-looking; fractures with curved surface |
| 10. Pumice | lightweight and holey; looks like a cinder; comes from volcanoes |
| 11. Rhyolite | pinkish-tan; crystals not visible without magnification |
| 12. Sandstone | cemented sand grains; color may vary |
| 13. Schist | may have long stretched crystals; may shimmer or look flaky |
| 14. Shale | color varies but usually dark; smells musty when it is moistened |
| 15. Slate | looks like a piece of blackboard; harder than #14 |
2012.11.24 This page has been accessed 1,410 times.
